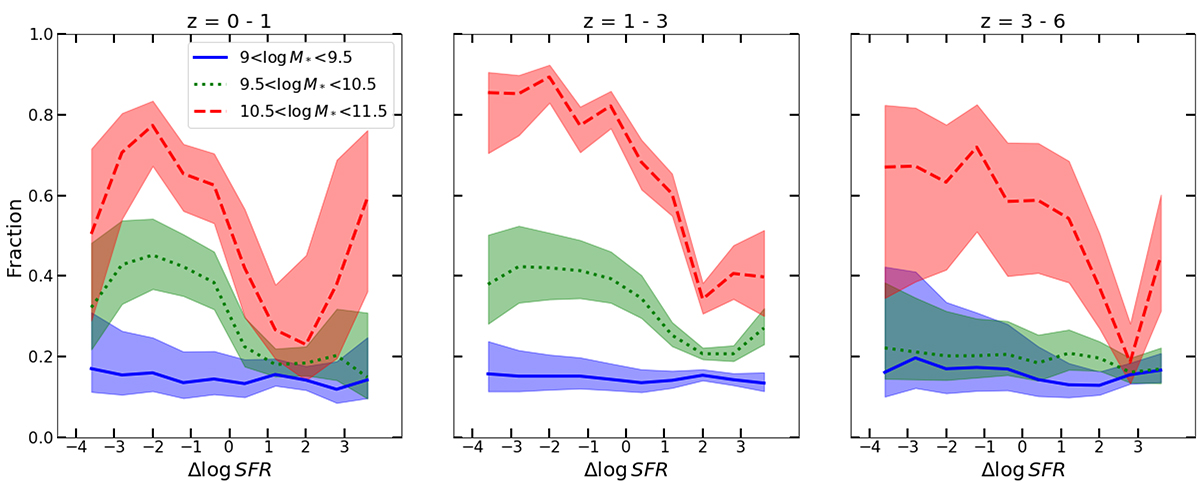
Fig. 17.
Download original image
Fraction of early-type galaxies as a function of Δlog SFR. Each panel shows a different redshift bin – 0 < z < 1, 1 < z < 3, 3 < z < 6 – from left to right. The red dashed, green dotted and solid blue lines show galaxies with stellar masses of 10.5 < log M*/M⊙ < 11.5, 9.5 < log M*/M⊙ < 10.5, 9.5 < log M*/M⊙ < 10.5 respectively. The morphology-quenching relation seems to be in place for massive galaxies at z > 3.
Current usage metrics show cumulative count of Article Views (full-text article views including HTML views, PDF and ePub downloads, according to the available data) and Abstracts Views on Vision4Press platform.
Data correspond to usage on the plateform after 2015. The current usage metrics is available 48-96 hours after online publication and is updated daily on week days.
Initial download of the metrics may take a while.