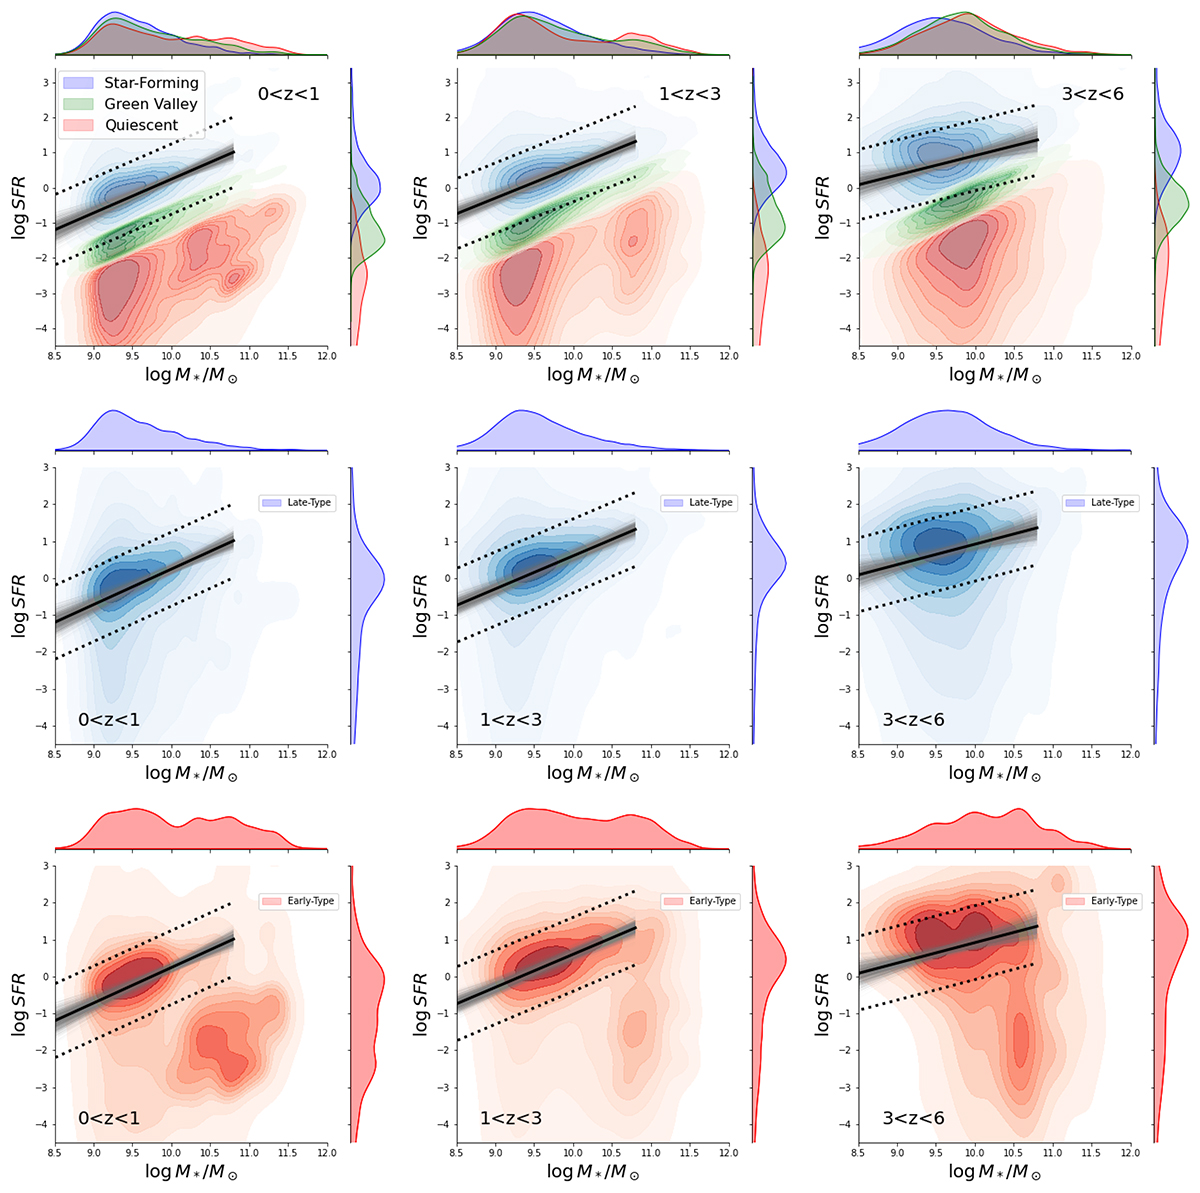
Fig. 16.

Download original image
Stellar mass-and-star formation rate (M⊙ ⋅ yr−1) plane in different redshift bins as labeled. The top row shows the whole sample analyzed in this work divided in star-forming (blue contours), green valley (green contours), and quiescent galaxies (red contours) based on the mass doubling time (see text for details). The middle row shows the distribution of late-type galaxies and the bottom row the one for early-type galaxies. In all panels, the solid line shows the mean of the posterior power-law fit to star-forming galaxies and the gray shaded regions indicates random samples of the posterior distribution. The dotted lines indicate the location ±1 dex around the main sequence.
Current usage metrics show cumulative count of Article Views (full-text article views including HTML views, PDF and ePub downloads, according to the available data) and Abstracts Views on Vision4Press platform.
Data correspond to usage on the plateform after 2015. The current usage metrics is available 48-96 hours after online publication and is updated daily on week days.
Initial download of the metrics may take a while.


