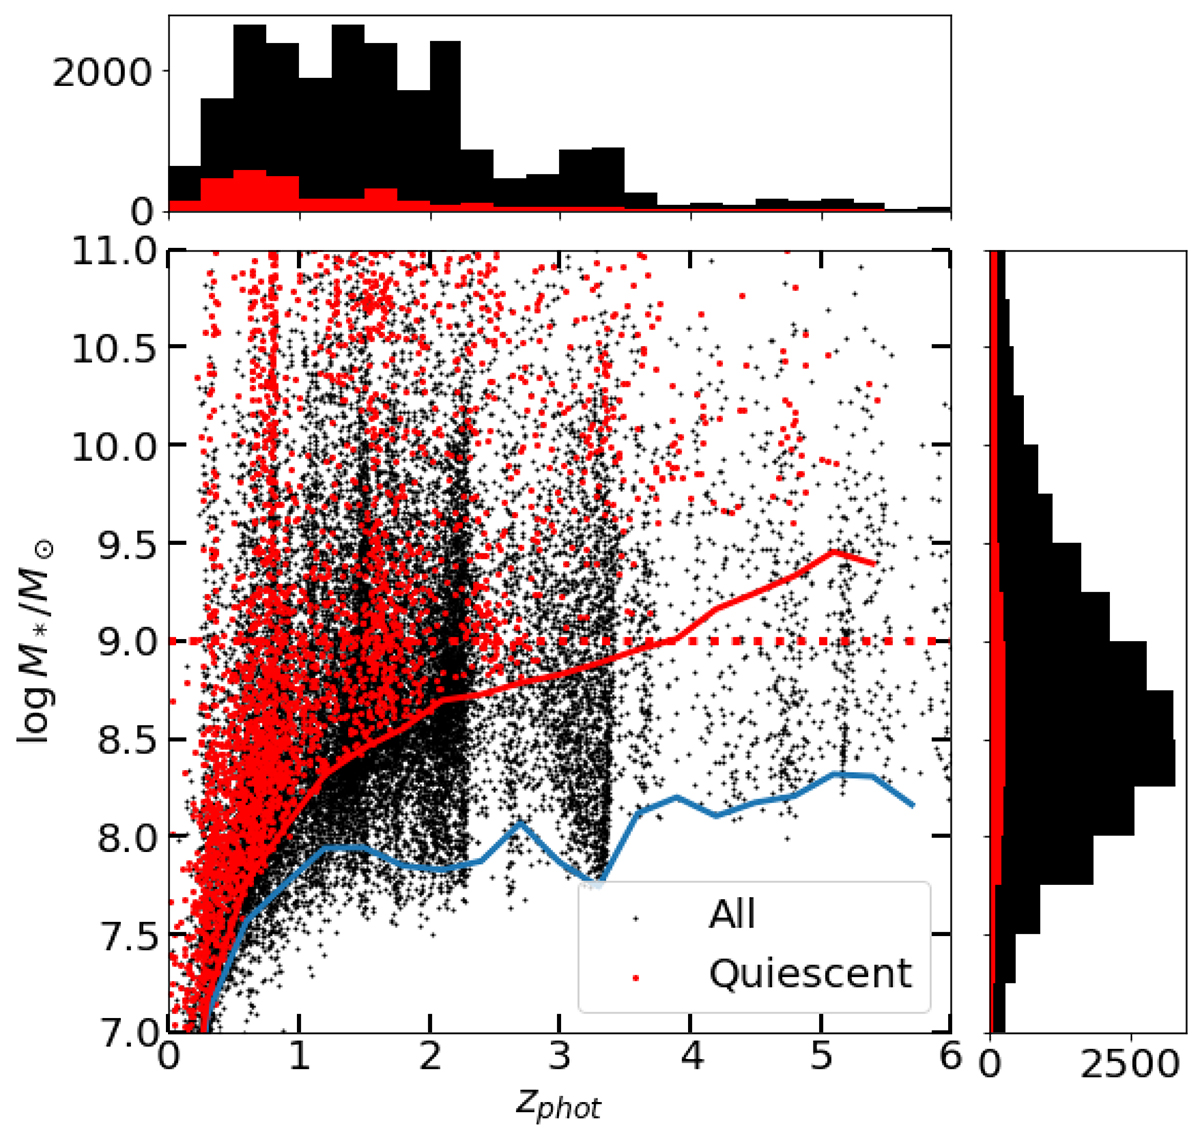
Fig. 1.
Download original image
Distribution of selected galaxies (F200W < 27) in the stellar mass-photometric redshift plane. Black points show the complete sample and red point are quiescent galaxies. The dashed red line shows the 109 solar mass limit used in this work for scientific analysis. The solid blue and red lines indicate the 90% mass completeness limit for the global sample and for quiescent galaxies respectively (see text for details). Overall our analysis threshold is well above the completeness limit except for the population of high-redshift quiescent galaxies.
Current usage metrics show cumulative count of Article Views (full-text article views including HTML views, PDF and ePub downloads, according to the available data) and Abstracts Views on Vision4Press platform.
Data correspond to usage on the plateform after 2015. The current usage metrics is available 48-96 hours after online publication and is updated daily on week days.
Initial download of the metrics may take a while.