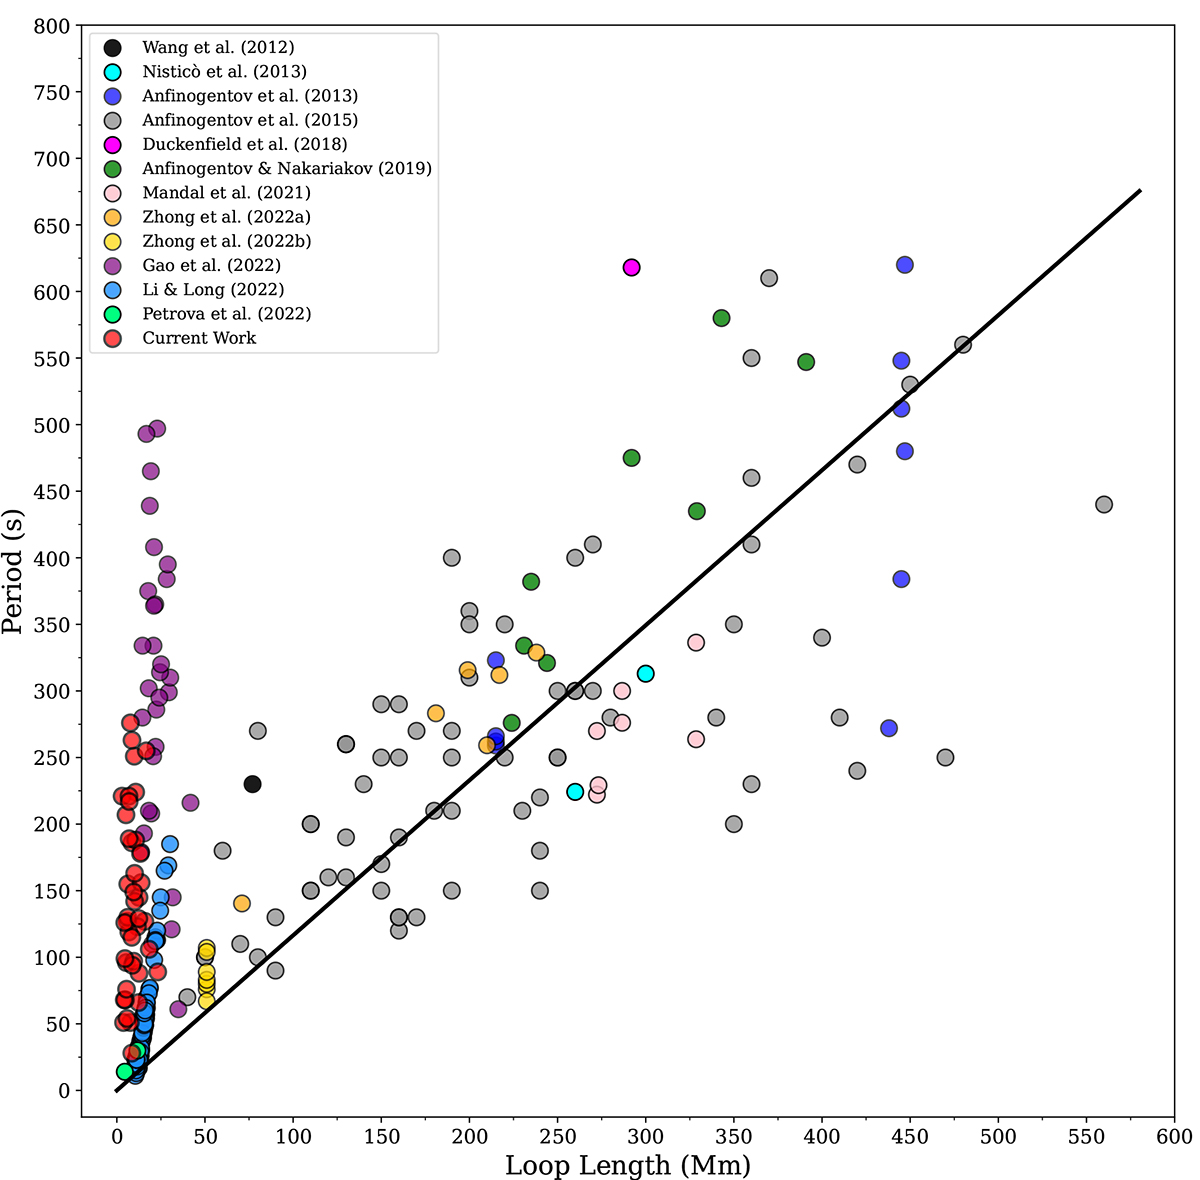
Fig. 5.
Download original image
Scaling between the loop length and the period. The figure shows the variation in the loop length vs. the period of the decayless oscillations analysed in previous studies (Wang et al. 2012; Nisticò et al. 2013; Anfinogentov et al. 2013, 2015; Duckenfield et al. 2018; Anfinogentov & Nakariakov 2019; Mandal et al. 2021b; Zhong et al. 2022a,b; Petrova et al. 2023; Gao et al. 2022; Li & Long 2023). The red points represent the results of the current work. The black lines represent the best fit for the datasets.
Current usage metrics show cumulative count of Article Views (full-text article views including HTML views, PDF and ePub downloads, according to the available data) and Abstracts Views on Vision4Press platform.
Data correspond to usage on the plateform after 2015. The current usage metrics is available 48-96 hours after online publication and is updated daily on week days.
Initial download of the metrics may take a while.