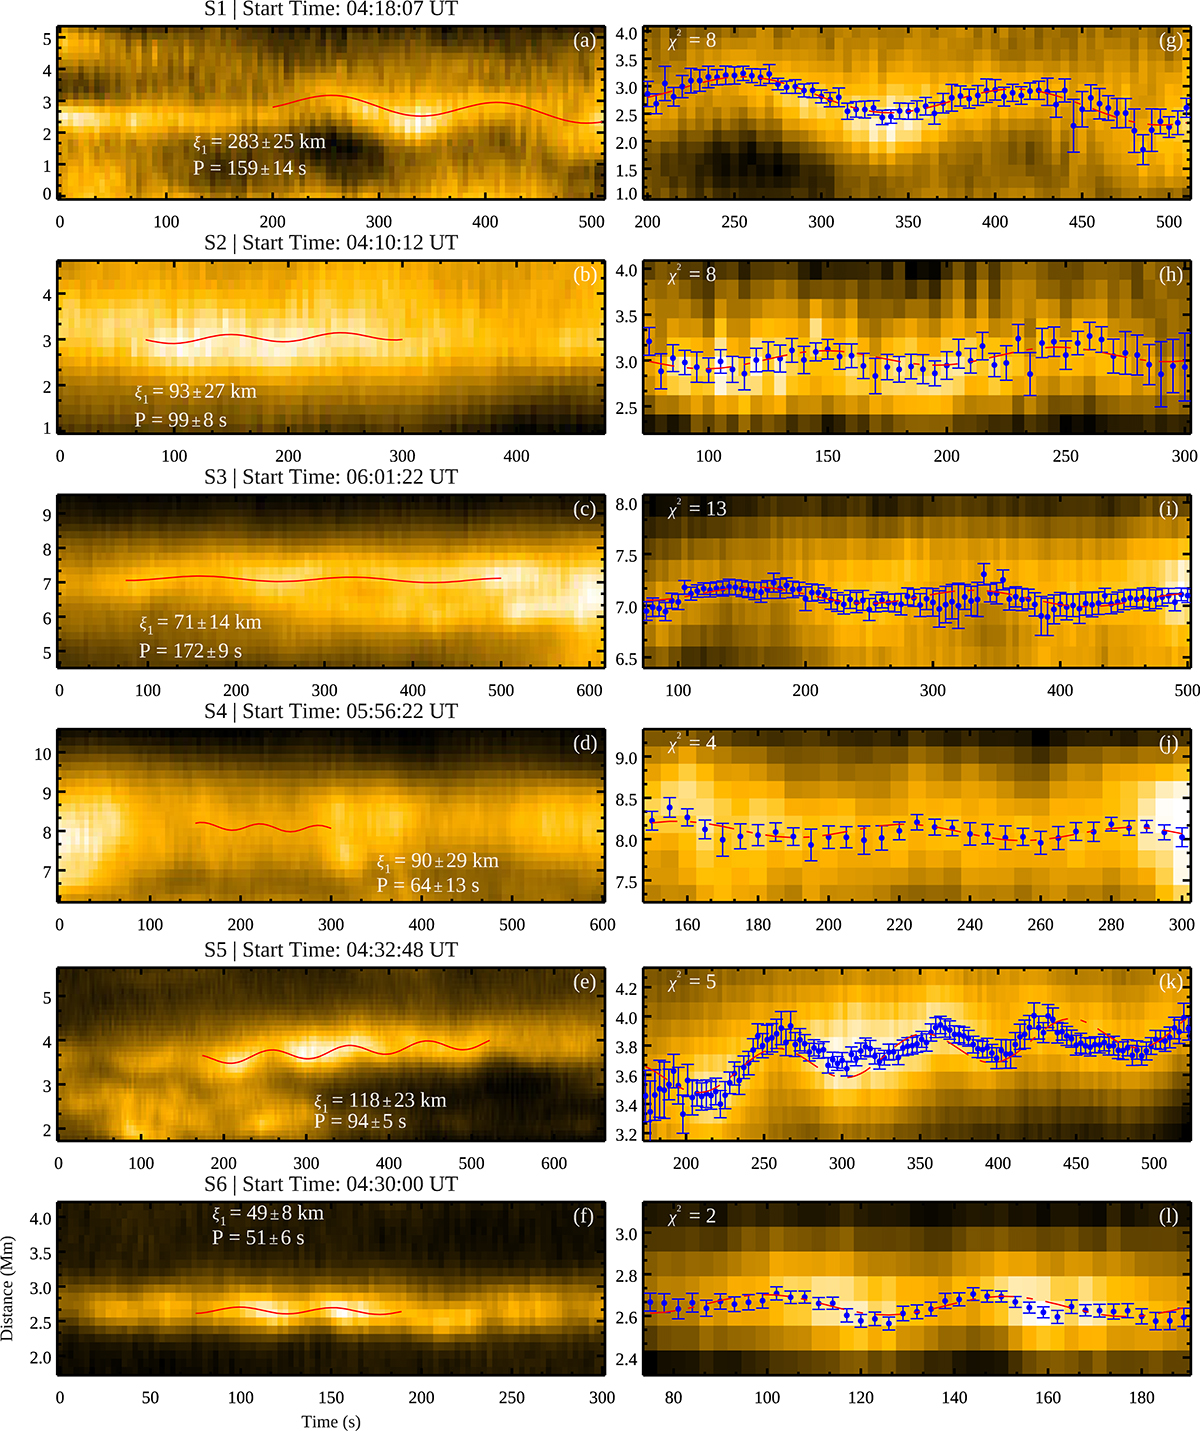
Fig. 2.
Download original image
Overview of x − t maps. Panels a–f show the x − t maps produced for slits S1 to S6 indicated in Figs. 1d–i. The red curves depict the best fit for the oscillations. The error bars represent standard errors on the centre position of the loop. The amplitude, ξ1, and period, P, of the oscillation, along with the propagated errors, are written close to the fitted oscillations. A few x − t maps show only part of the slits so that the oscillations are better visible. Panels g–l show the fitted oscillations along with the error bars for the position of the loop. These correspond to the x − t maps shown in panels a–f. The dashed curves show the overplotted best-fit model. The chi-square values for the fits are also provided.
Current usage metrics show cumulative count of Article Views (full-text article views including HTML views, PDF and ePub downloads, according to the available data) and Abstracts Views on Vision4Press platform.
Data correspond to usage on the plateform after 2015. The current usage metrics is available 48-96 hours after online publication and is updated daily on week days.
Initial download of the metrics may take a while.