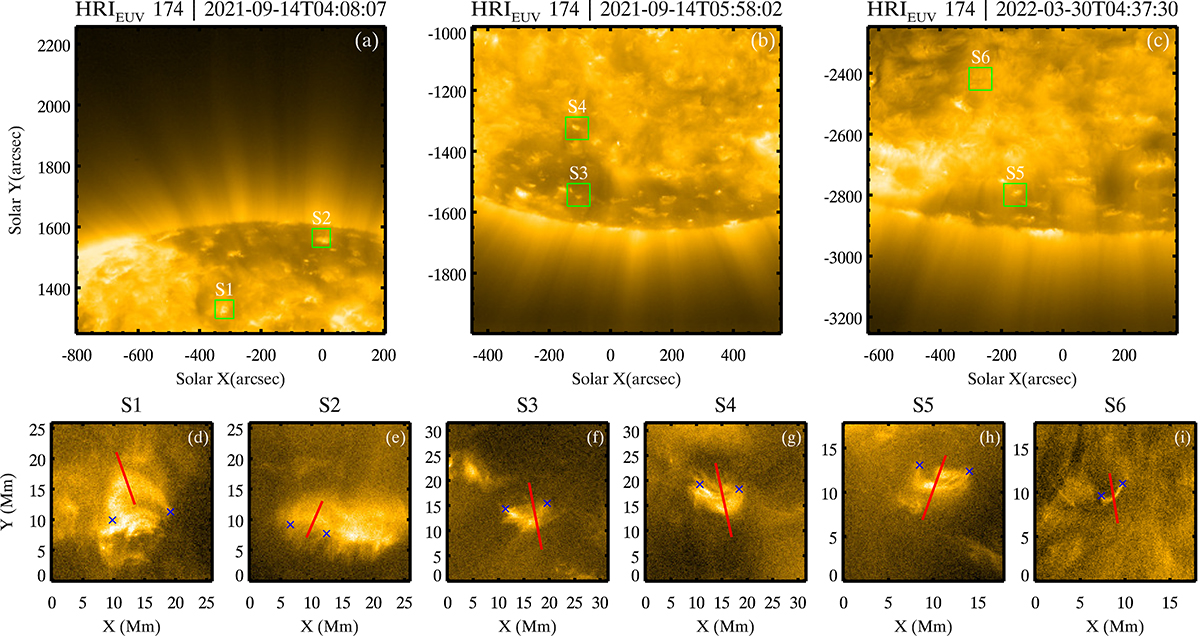
Fig. 1.
Download original image
Description of events. Panels a, b, and c represent the context images of the three datasets. The green boxes show examples of the selected loops for which oscillations are detected. The other loops we studied appear at different times and are not shown here. A magnified view of the loops in the green boxes for each upper panel is shown in the lower panels. The red lines in panels d–i depict the position of the artificial slits we used to generate the x − t maps. The blue crosses in each panel show the approximate position of the footpoints. Details of the dataset are provided in Table 1. An animation related to this figure is accessible online.
Current usage metrics show cumulative count of Article Views (full-text article views including HTML views, PDF and ePub downloads, according to the available data) and Abstracts Views on Vision4Press platform.
Data correspond to usage on the plateform after 2015. The current usage metrics is available 48-96 hours after online publication and is updated daily on week days.
Initial download of the metrics may take a while.