Fig. B.1
Download original image
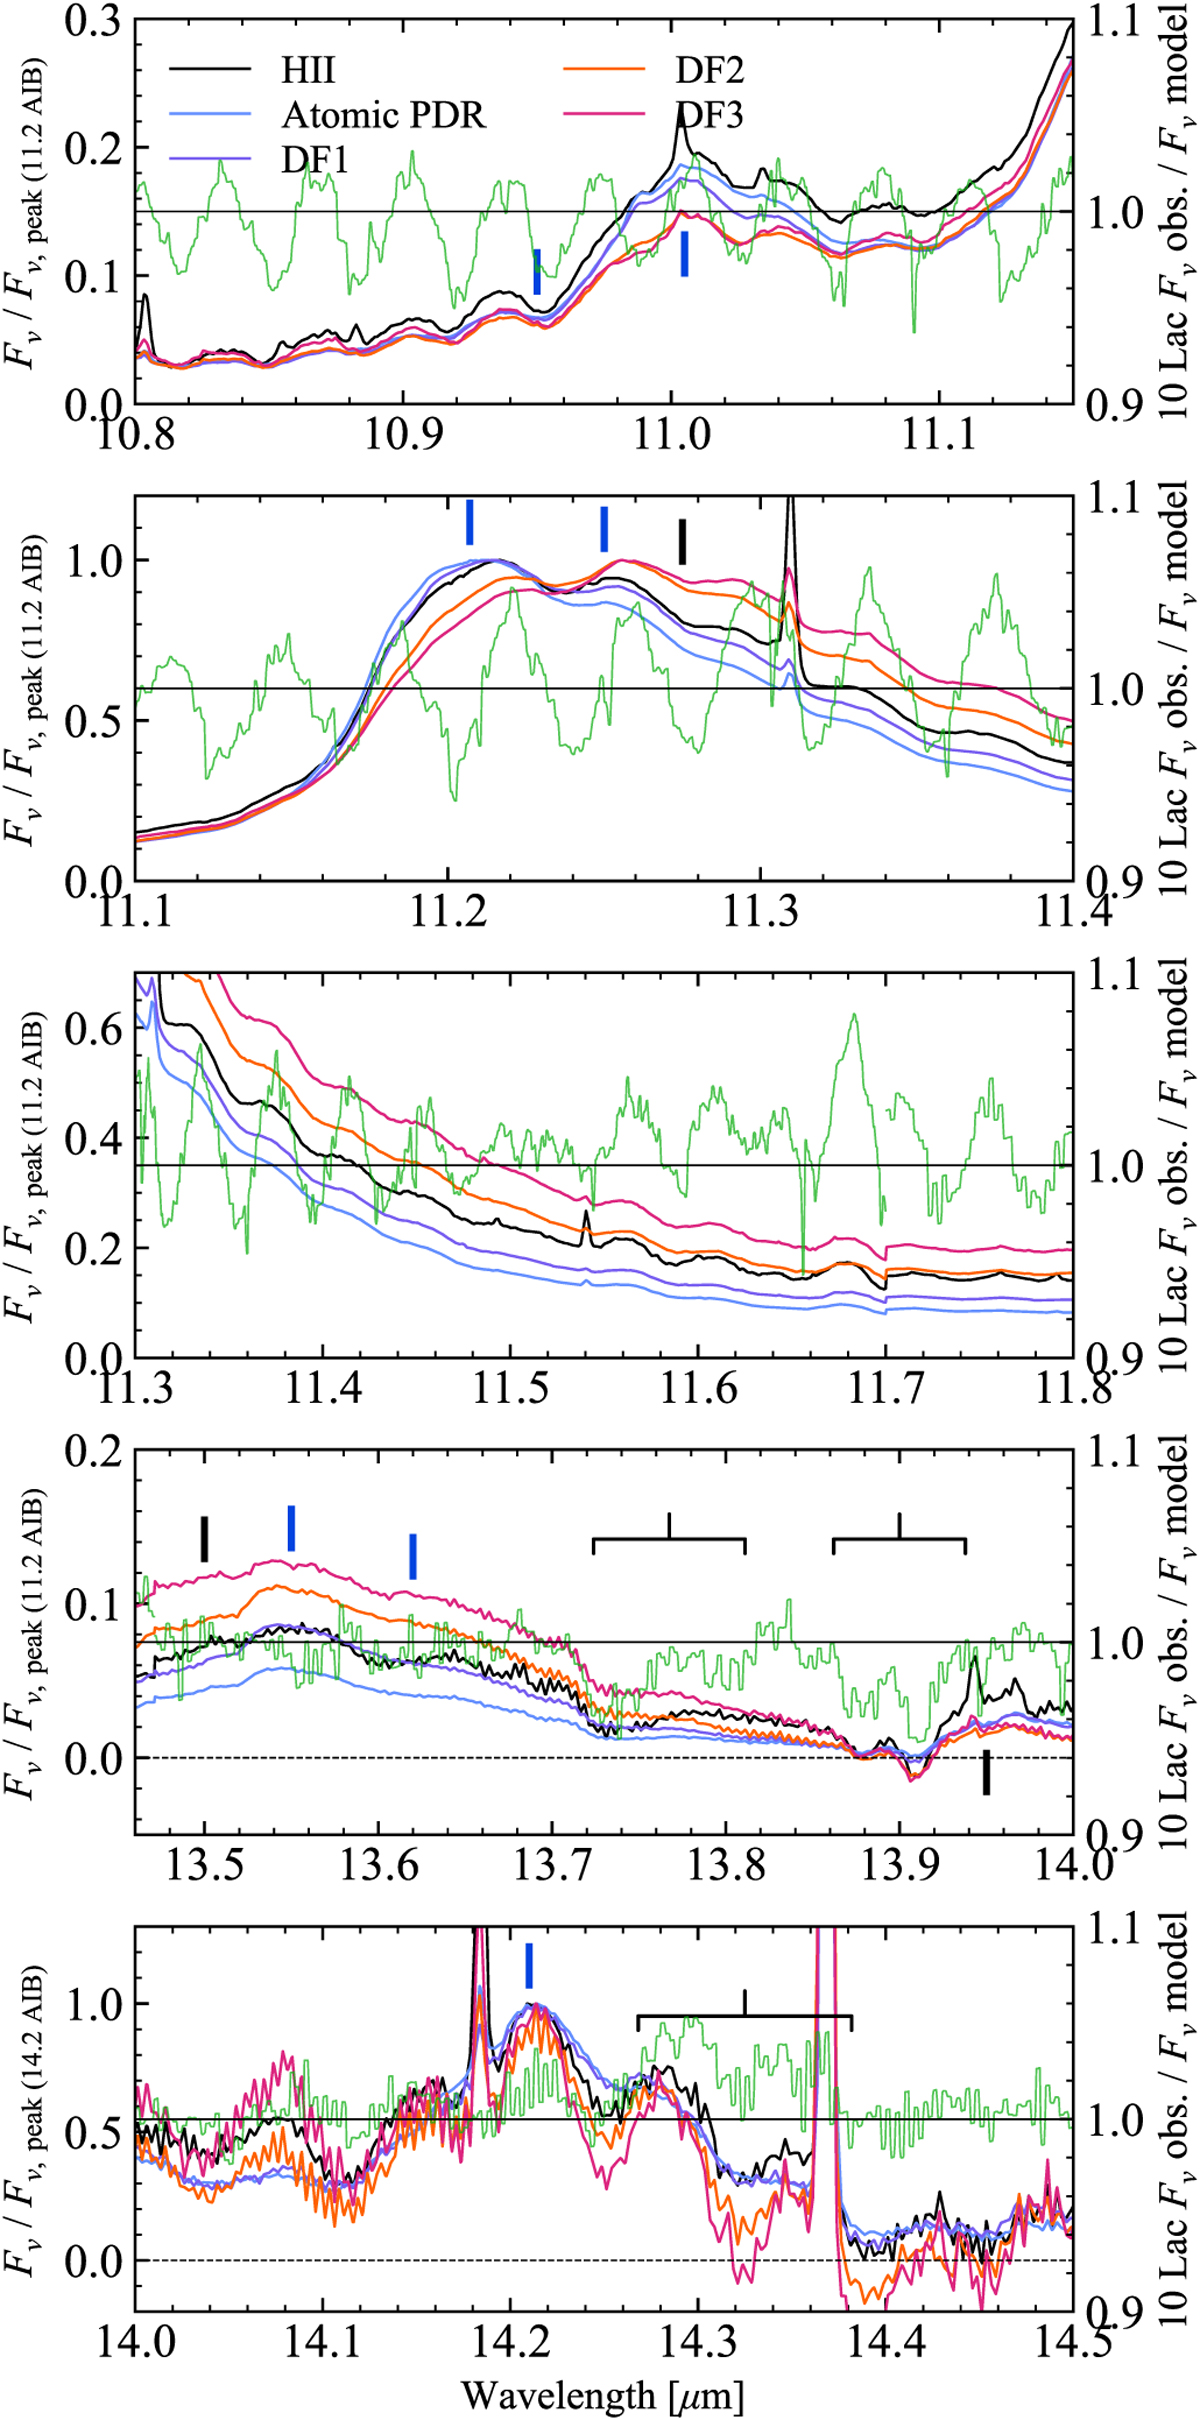
Zoom-ins on continuum-subtracted template spectra (not corrected for calibration issues, i.e. ![]() in Eq. B.2), compared with the MIRI-MRS spectrum of the absolute calibration star 10 Lac divided by the model for this star (green). The positions of identified AIB features are shown with vertical lines. The bracketed regions indicate excess absorption or emission artifacts due to incomplete flux calibration (Appendix B).
in Eq. B.2), compared with the MIRI-MRS spectrum of the absolute calibration star 10 Lac divided by the model for this star (green). The positions of identified AIB features are shown with vertical lines. The bracketed regions indicate excess absorption or emission artifacts due to incomplete flux calibration (Appendix B).
Current usage metrics show cumulative count of Article Views (full-text article views including HTML views, PDF and ePub downloads, according to the available data) and Abstracts Views on Vision4Press platform.
Data correspond to usage on the plateform after 2015. The current usage metrics is available 48-96 hours after online publication and is updated daily on week days.
Initial download of the metrics may take a while.