Fig. 4
Download original image
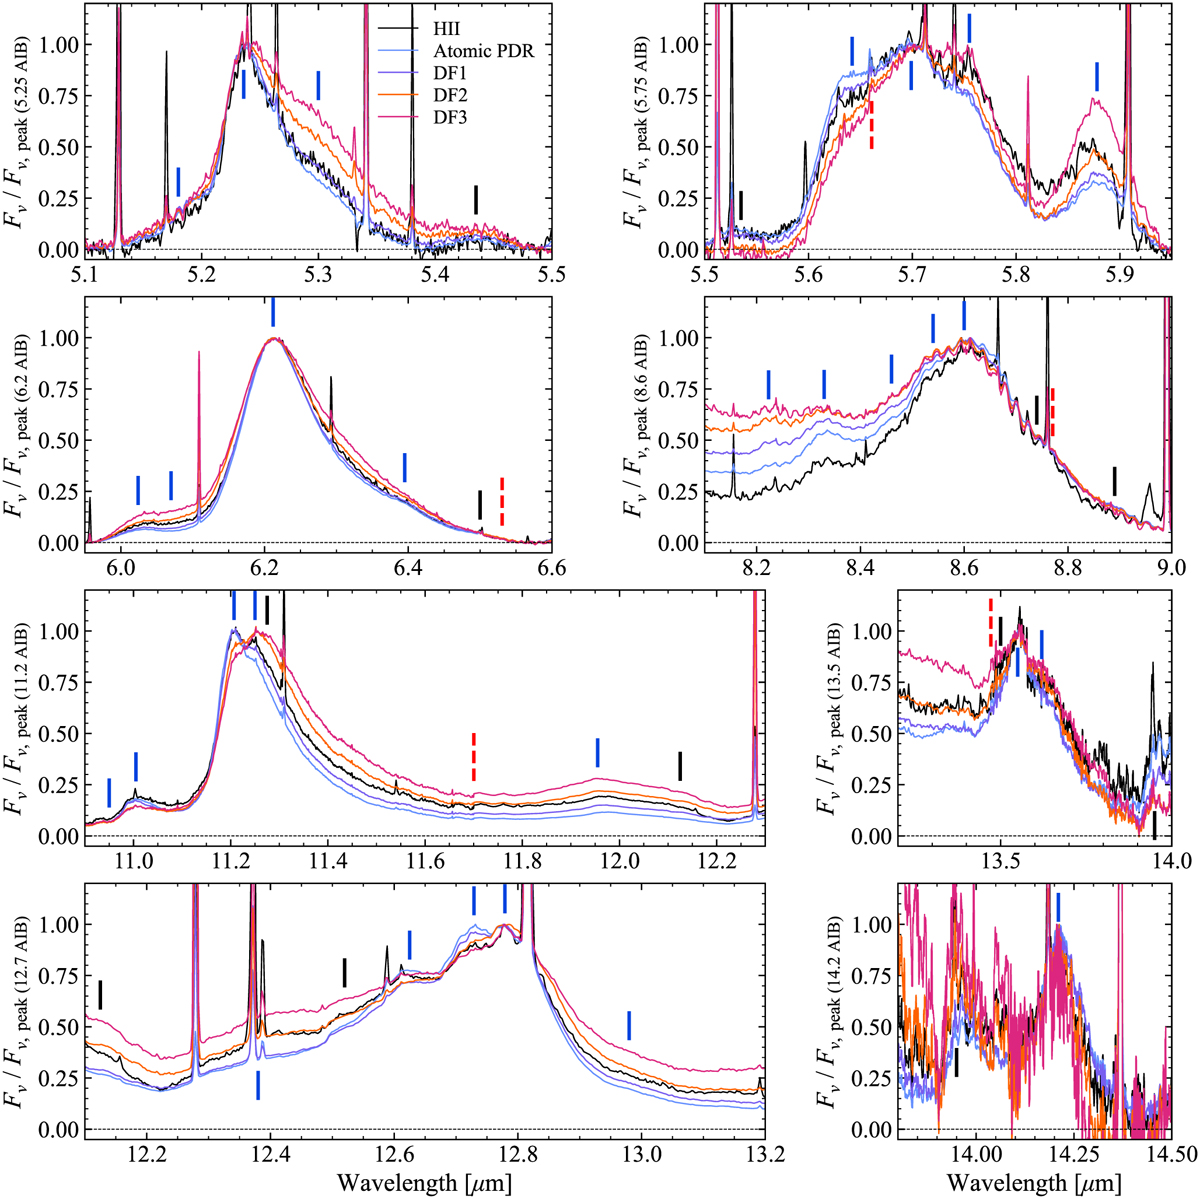
Continued from Fig. 3. From left to right, top to bottom: zoom-ins on the template spectra normalised by the peak flux of the 5.25, 5.75 and 5.878, 6.2, 8.6, 11.2 and 12.0, 12.7, 13.5, and 14.2 µm AIBs (indicated in the y-axis label of each panel). The panels show wavelength ranges that are also shown in Fig. 3, except for the panels that are centered on the 13.5 and 14.2 µm AIBs (small panels in the lower right). These figures illustrate the overall similarity and subtle differences in AIB profiles from region to region.
Current usage metrics show cumulative count of Article Views (full-text article views including HTML views, PDF and ePub downloads, according to the available data) and Abstracts Views on Vision4Press platform.
Data correspond to usage on the plateform after 2015. The current usage metrics is available 48-96 hours after online publication and is updated daily on week days.
Initial download of the metrics may take a while.