Fig. 3
Download original image
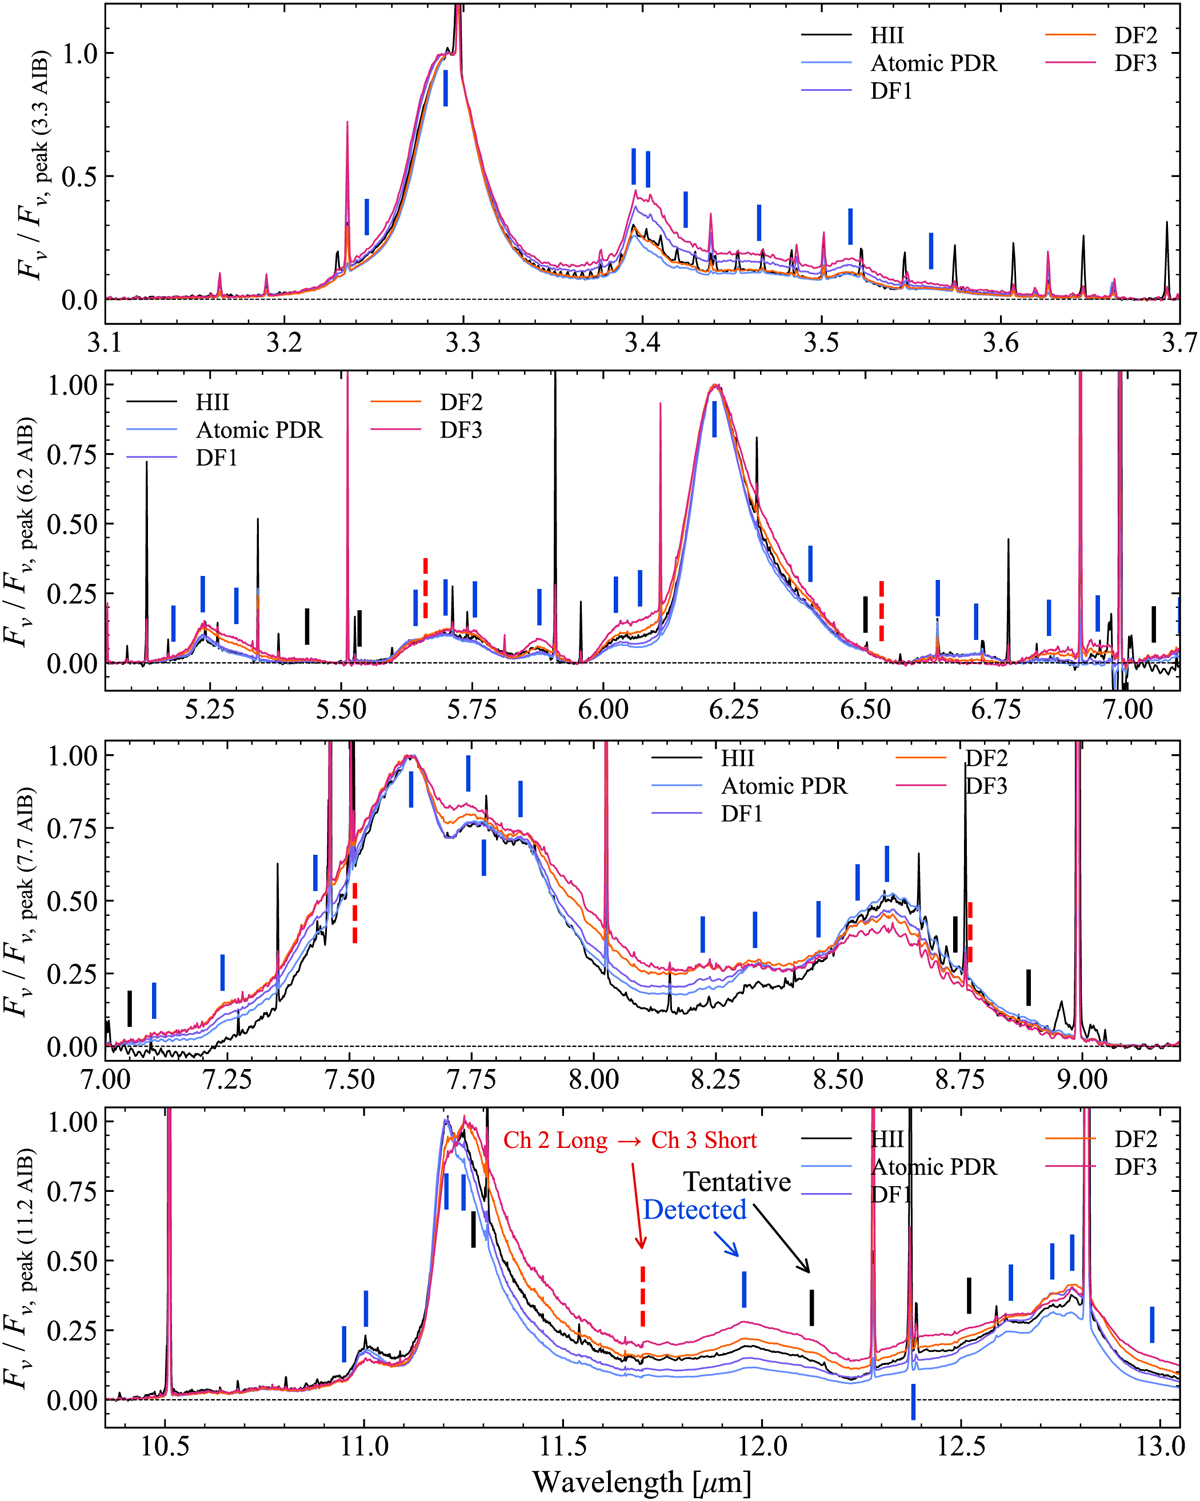
Zoom-ins on the template spectra at wavelength regions centered on the 3.3 µm AIB (Peeters et al. 2024, top), the 6.2 µm AIB (second from top), the 7.7 µm AIB (second from bottom), and the 11.2 µm AIB (bottom). Each spectrum (on an Fν scale) is normalised by the peak surface brightness of the indicated AIB on the y-axes in each panel. The vertical tick marks indicate the positions of identified (blue) or tentative (black) AIBs and components (see Table A.1 and main text). A post-pipeline correction for residual artifacts was performed for Ch2-long (10.02–11.70 µm), Ch3-medium (13.34–15.57 µm), and Ch3-long (15.41–17.98 µm). For further details, see Appendix B. Red dashed vertical ticks indicate the wavelengths where we switch from using data from one MRS sub-band to another. Continued in Fig. 4.
Current usage metrics show cumulative count of Article Views (full-text article views including HTML views, PDF and ePub downloads, according to the available data) and Abstracts Views on Vision4Press platform.
Data correspond to usage on the plateform after 2015. The current usage metrics is available 48-96 hours after online publication and is updated daily on week days.
Initial download of the metrics may take a while.