Open Access
Fig. 2
Download original image
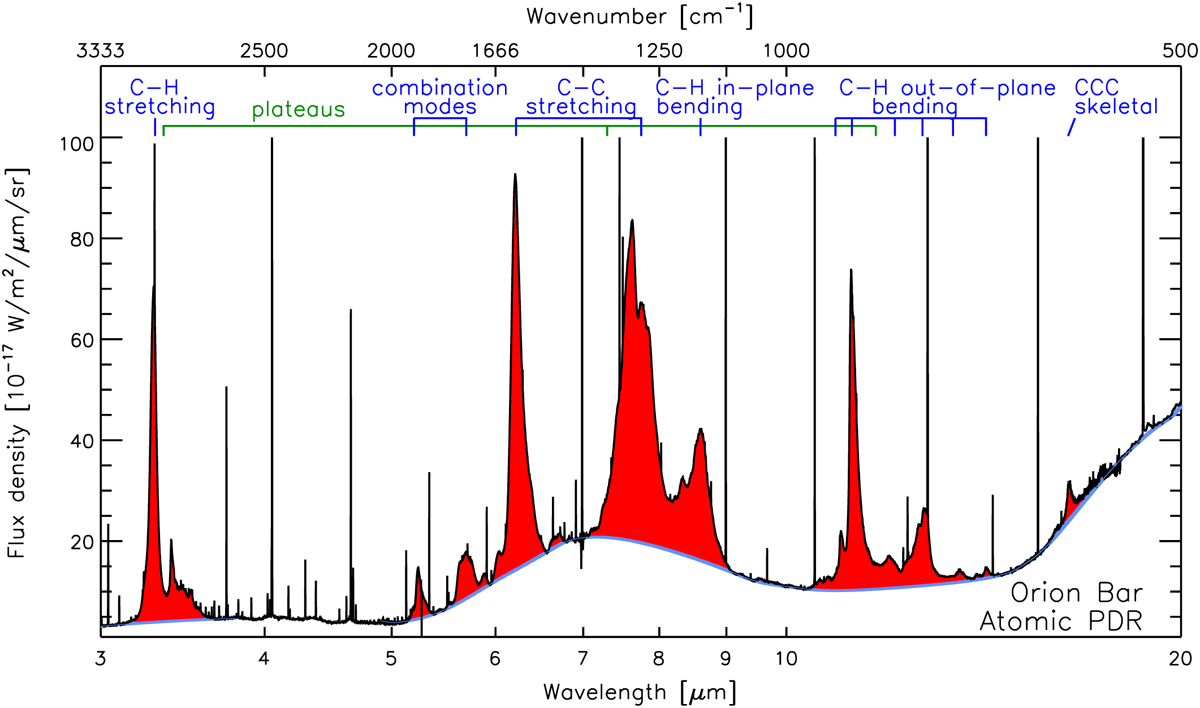
AIB spectrum as seen by JWST using the Orion Bar atomic PDR template spectrum (Sect. 2.2) as an example. Red shaded regions indicate emission from AIBs while blue curves indicate the underlying continuum. Figure is adapted from Peeters et al. (2004a).
Current usage metrics show cumulative count of Article Views (full-text article views including HTML views, PDF and ePub downloads, according to the available data) and Abstracts Views on Vision4Press platform.
Data correspond to usage on the plateform after 2015. The current usage metrics is available 48-96 hours after online publication and is updated daily on week days.
Initial download of the metrics may take a while.