Fig. 8
Download original image
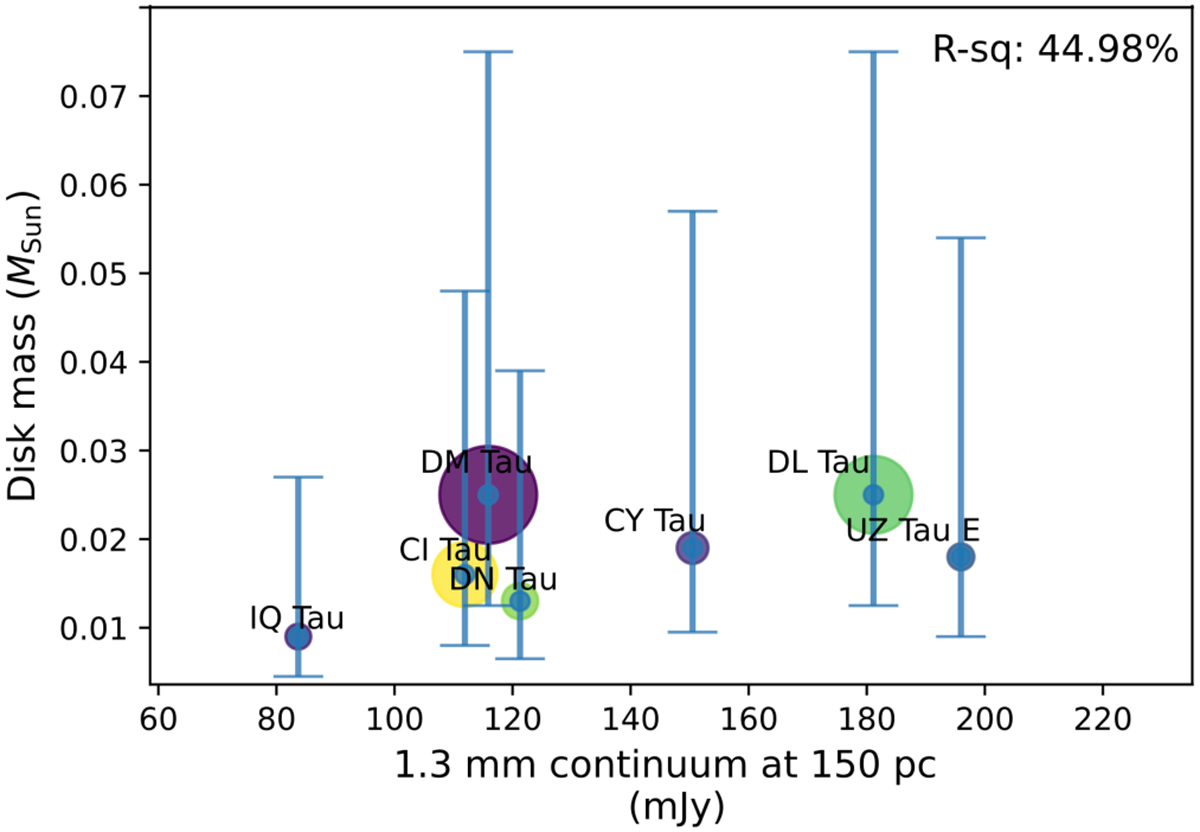
Correlation between the thermal dust continuum fluxes at 1.3 mm and the disk gas masses derived by rescaling disk dust masses. The size of the disk symbol reflects the disk size, and the color of the symbol designates the luminosity of the central star (darker colors correspond to lower luminosities). The coefficient of determination (corresponding to the Pearson coefficient r to the power of two) was calculated by taking the data uncertainties into account and is shown in the top right corner.
Current usage metrics show cumulative count of Article Views (full-text article views including HTML views, PDF and ePub downloads, according to the available data) and Abstracts Views on Vision4Press platform.
Data correspond to usage on the plateform after 2015. The current usage metrics is available 48-96 hours after online publication and is updated daily on week days.
Initial download of the metrics may take a while.