Open Access
Fig. 7
Download original image
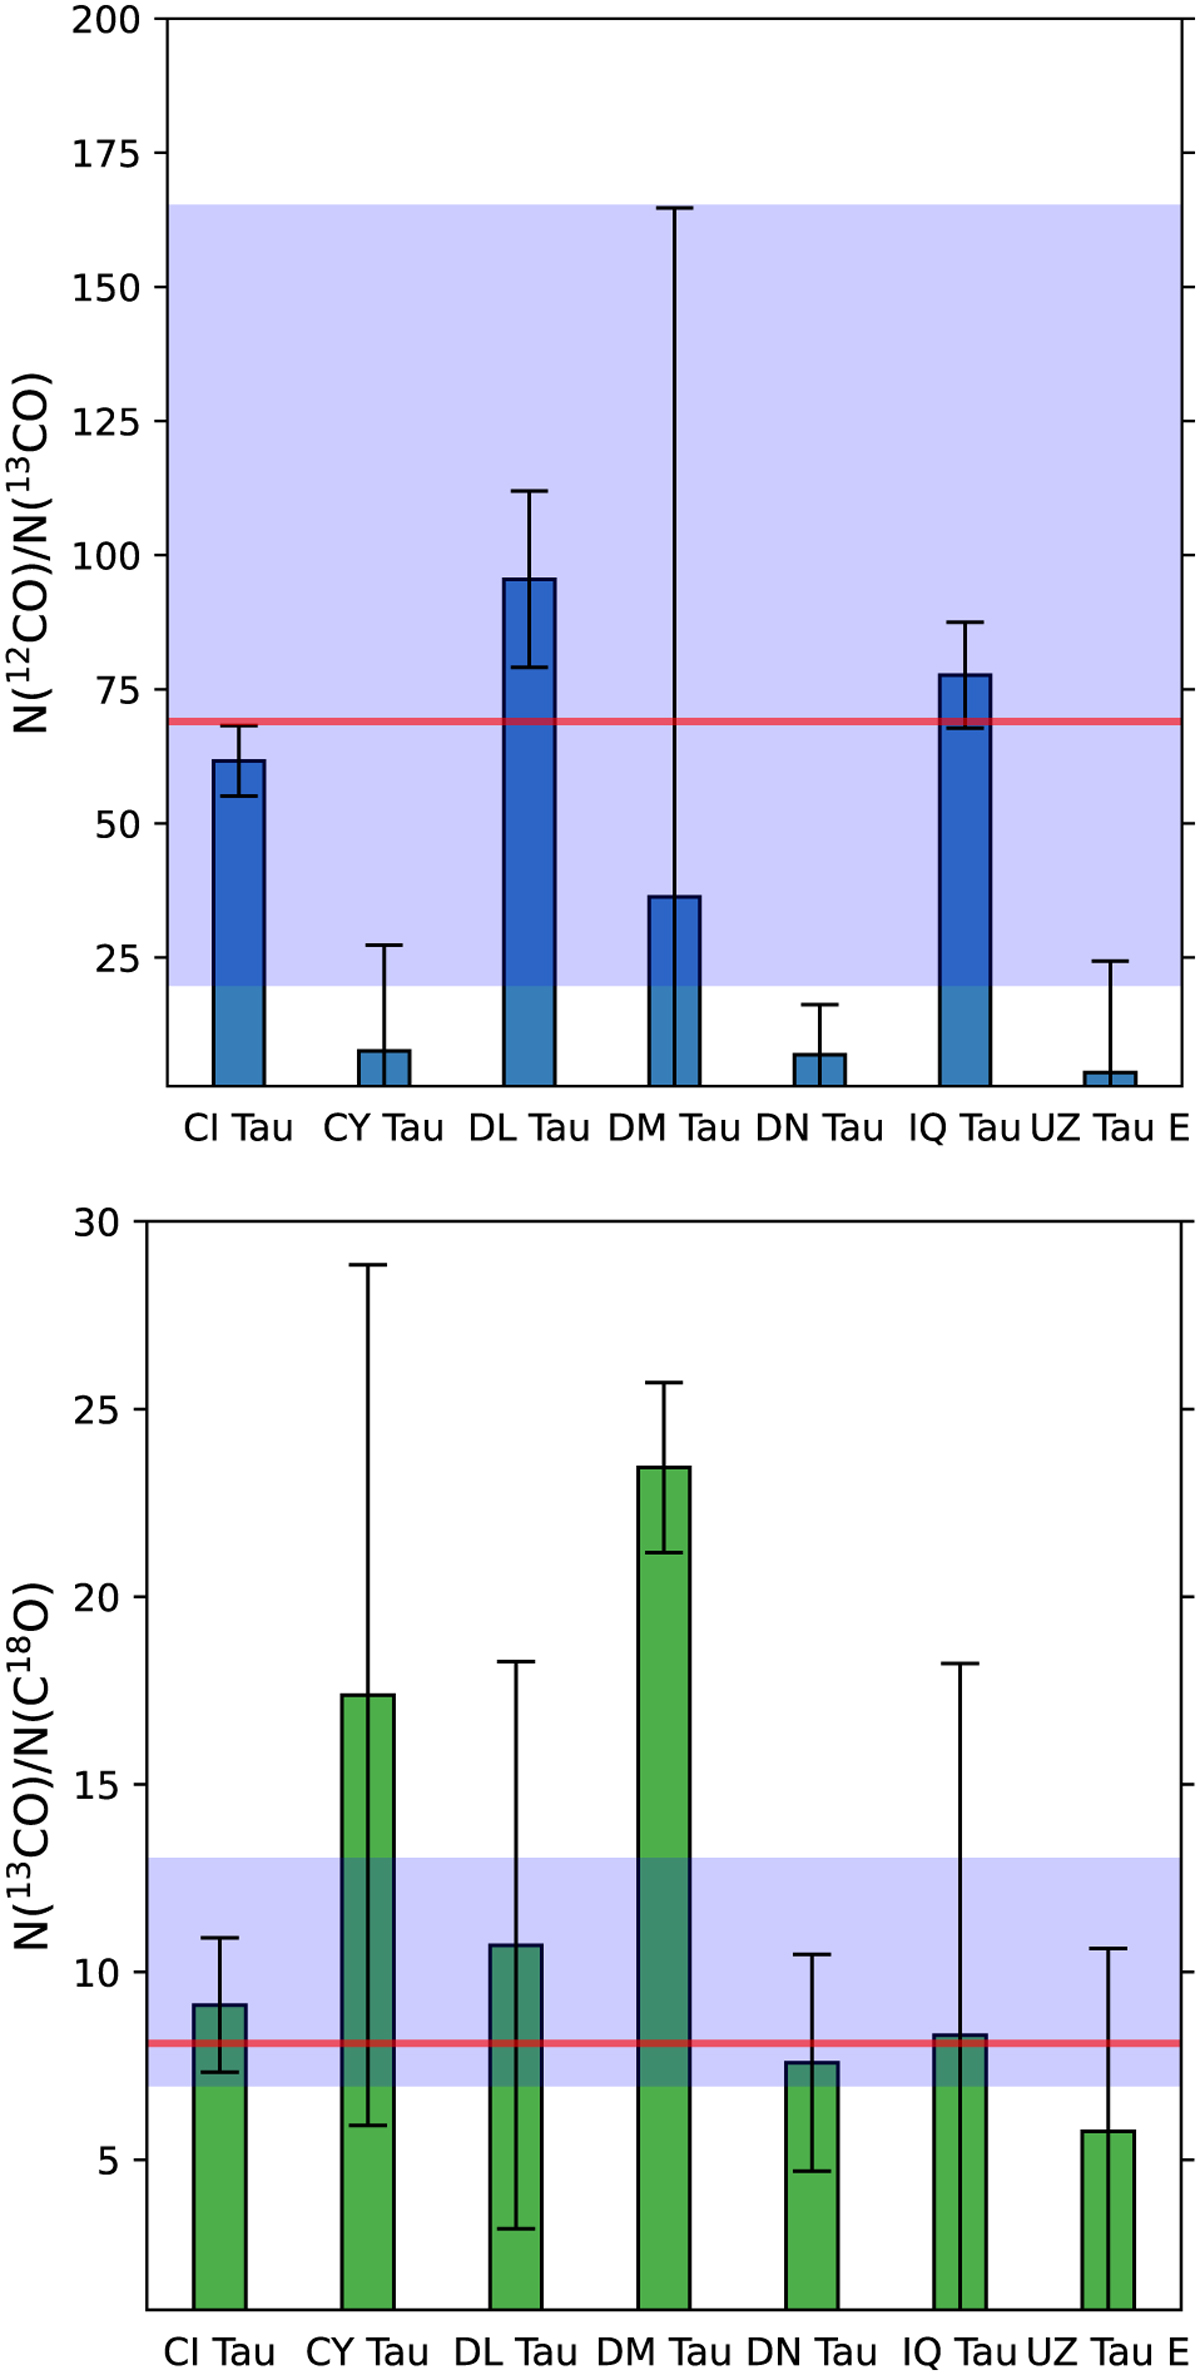
Column density ratios of 12CO/13CO (top) and 13CO/C18O (bottom) at a disk radius of 100 au. The shaded area shows the isotopic ratios measured in disks or the ISM. The local ISM isotopic ratios are shown by the thick red line.
Current usage metrics show cumulative count of Article Views (full-text article views including HTML views, PDF and ePub downloads, according to the available data) and Abstracts Views on Vision4Press platform.
Data correspond to usage on the plateform after 2015. The current usage metrics is available 48-96 hours after online publication and is updated daily on week days.
Initial download of the metrics may take a while.