Fig. C.19

Download original image
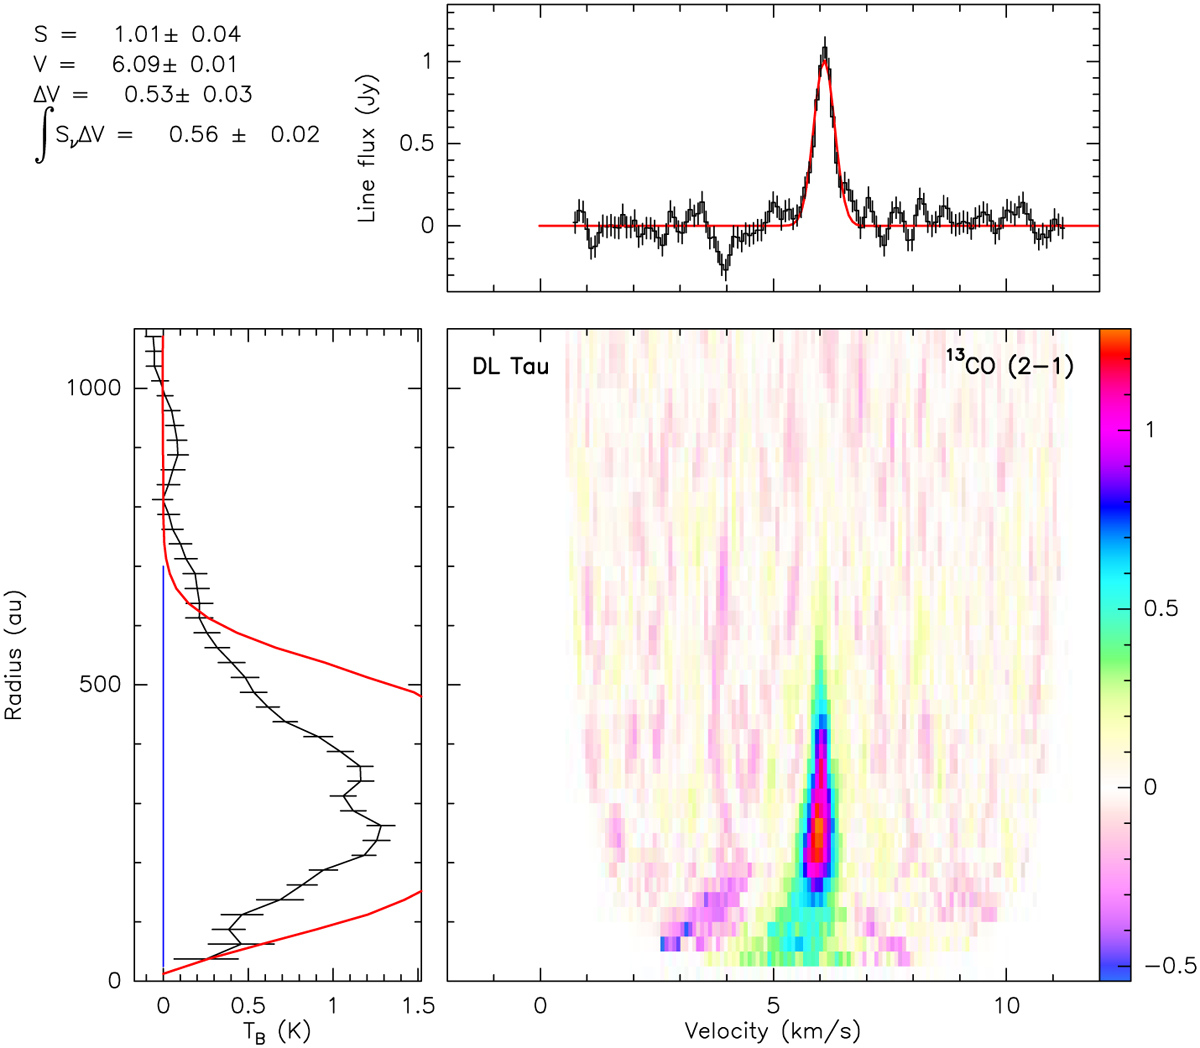
Observations of 13CO (2–1) emission in the DL Tau disk. Shown is a pixel-deprojected Keplerian plot consisting of the three panels: (left) the radial profile of the line brightness temperature (K), with observations and errorbars in black, and profile derived from the best-fit disk model in red, (top) the integrated spectrum (black line) overlaid with the best-fit Gaussian profile (red line), and (bottom right) aligned and stacked line intensity (K) as a function of disk radius (Y-axis; au) and velocity (X-axis; km s−1). The color bar units are in Kelvin.
Current usage metrics show cumulative count of Article Views (full-text article views including HTML views, PDF and ePub downloads, according to the available data) and Abstracts Views on Vision4Press platform.
Data correspond to usage on the plateform after 2015. The current usage metrics is available 48-96 hours after online publication and is updated daily on week days.
Initial download of the metrics may take a while.


