Fig. C.16
Download original image
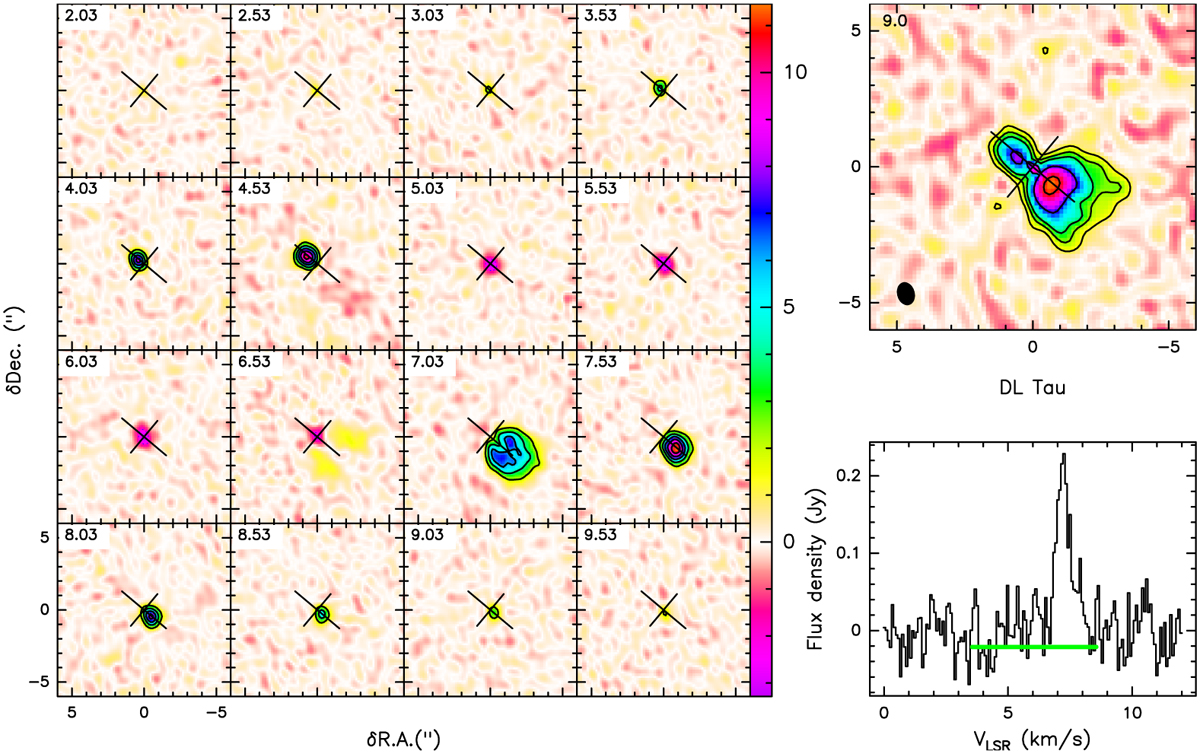
Observations of 12CO (2−1) emission in the DL Tau disk. Shown are the channel map of the observed line brightness distribution (left), the moment-zero map (top right), and the integrated spectrum (bottom right). The channel map shows 16 velocity channels with a step of 0.5 km s−1 in the [−4.5, +4.5] km s−1 range around the systemic velocity. The contour lines start at 2 K, with a step of 2 K. The color bar shows line brightness temperatures (K). The contour lines in the moment-zero plot start at 3, 6, and 9σ, with a step of 6σ afterward. The 1σ rms noise (mJy km s−1) is shown in the upper left corner of the moment-zero plot, and the synthesized beam is depicted by the dark ellipse in the left bottom corner.
Current usage metrics show cumulative count of Article Views (full-text article views including HTML views, PDF and ePub downloads, according to the available data) and Abstracts Views on Vision4Press platform.
Data correspond to usage on the plateform after 2015. The current usage metrics is available 48-96 hours after online publication and is updated daily on week days.
Initial download of the metrics may take a while.