Fig. 8.
Download original image
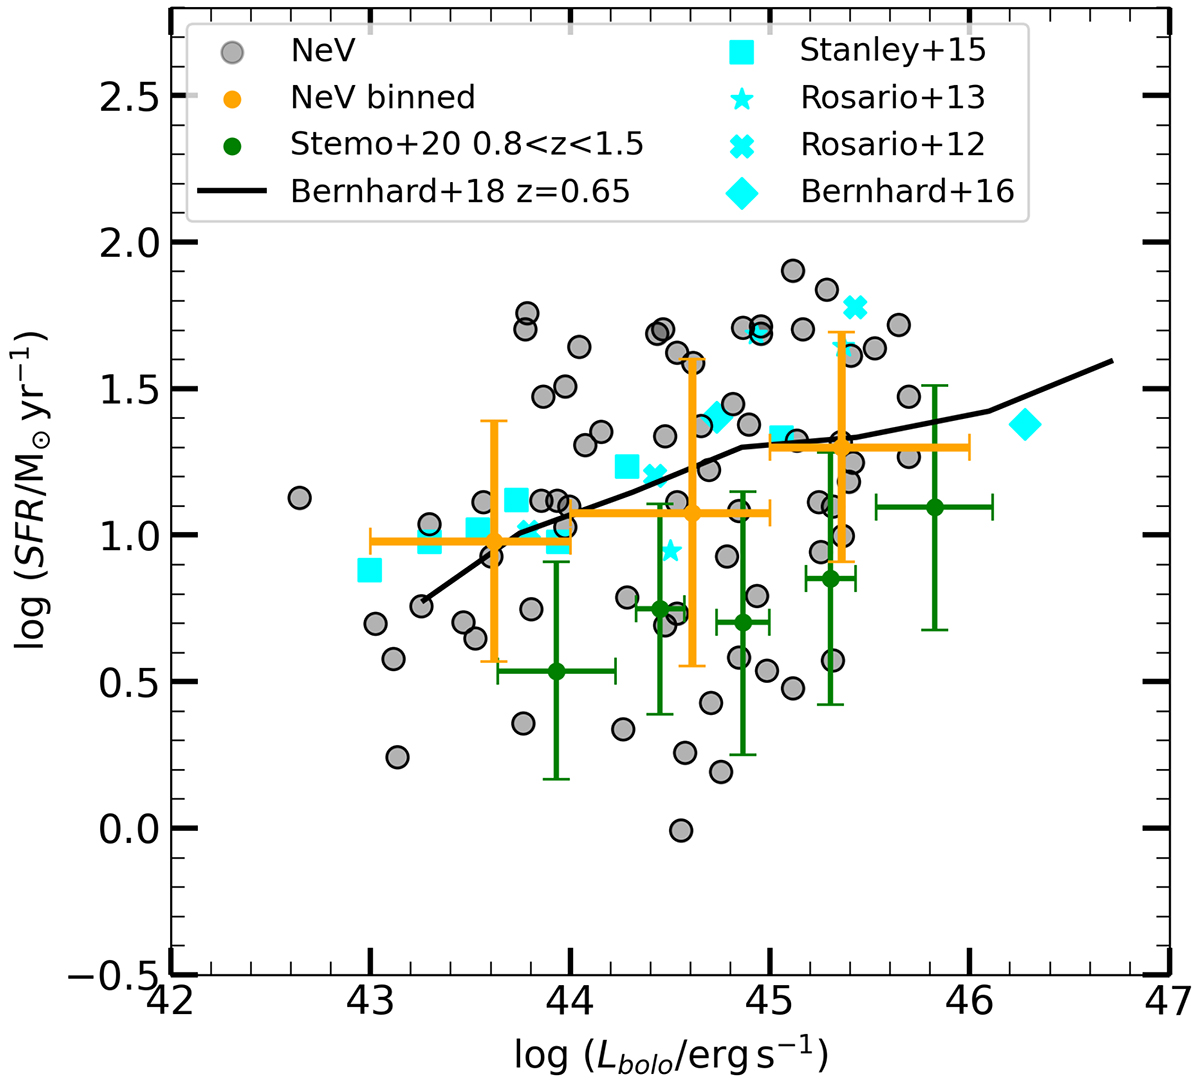
SFR as function of the AGN bolometric luminosity for the [Ne V]-selected AGNs (red circles). The average SFR in three bins of SFR is reported in orange, with the error bar representing the 16th and 84th percentiles. The green points are the average SFR for the sample of X-ray and IR -selected AGNs of Stemo et al. (2020), while the cyan symbols represent those from Rosario et al. (2012, 2013), Stanley et al. (2015), Bernhard et al. (2016) collected by Bernhard et al. (2018). The black line is the prediction from their mass-dependent model.
Current usage metrics show cumulative count of Article Views (full-text article views including HTML views, PDF and ePub downloads, according to the available data) and Abstracts Views on Vision4Press platform.
Data correspond to usage on the plateform after 2015. The current usage metrics is available 48-96 hours after online publication and is updated daily on week days.
Initial download of the metrics may take a while.