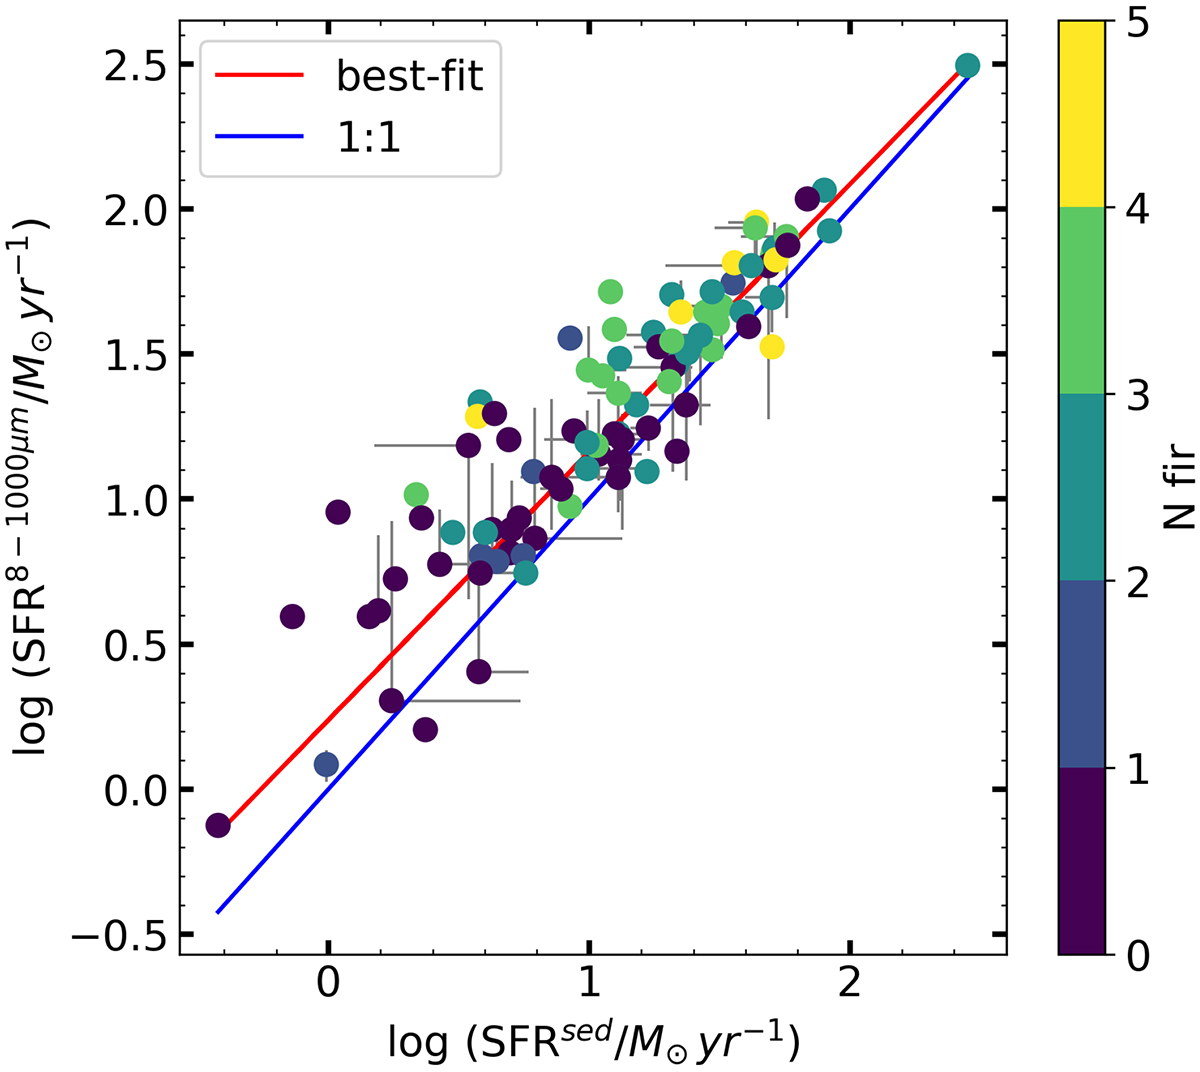
Fig. 6.
Download original image
Comparison between the SFR obtained from the optical-NIR bands with those from FIR. SFRsed are derived through the modeling of the stellar emission in the UV-to-NIR. The color code indicates the number of photometric detections for each source in the FIR band. A low number of FIR detections may influence the goodness of the FIR SED-fitting, hence the SFR8 − 1000 μm, but we did not find any trend between the SFR8 − 1000 μm–SFRsed offset and the number of IR photometric detections. The blue line is a 1:1 line; the red line is the best-fit line with a slope of m = 0.92 and c = 0.24, in the log(SFR8 − 1000 μm/M⊙ yr−1)=c + m log(SFRsed/M⊙ yr−1) notation.
Current usage metrics show cumulative count of Article Views (full-text article views including HTML views, PDF and ePub downloads, according to the available data) and Abstracts Views on Vision4Press platform.
Data correspond to usage on the plateform after 2015. The current usage metrics is available 48-96 hours after online publication and is updated daily on week days.
Initial download of the metrics may take a while.