Fig. 5.
Download original image
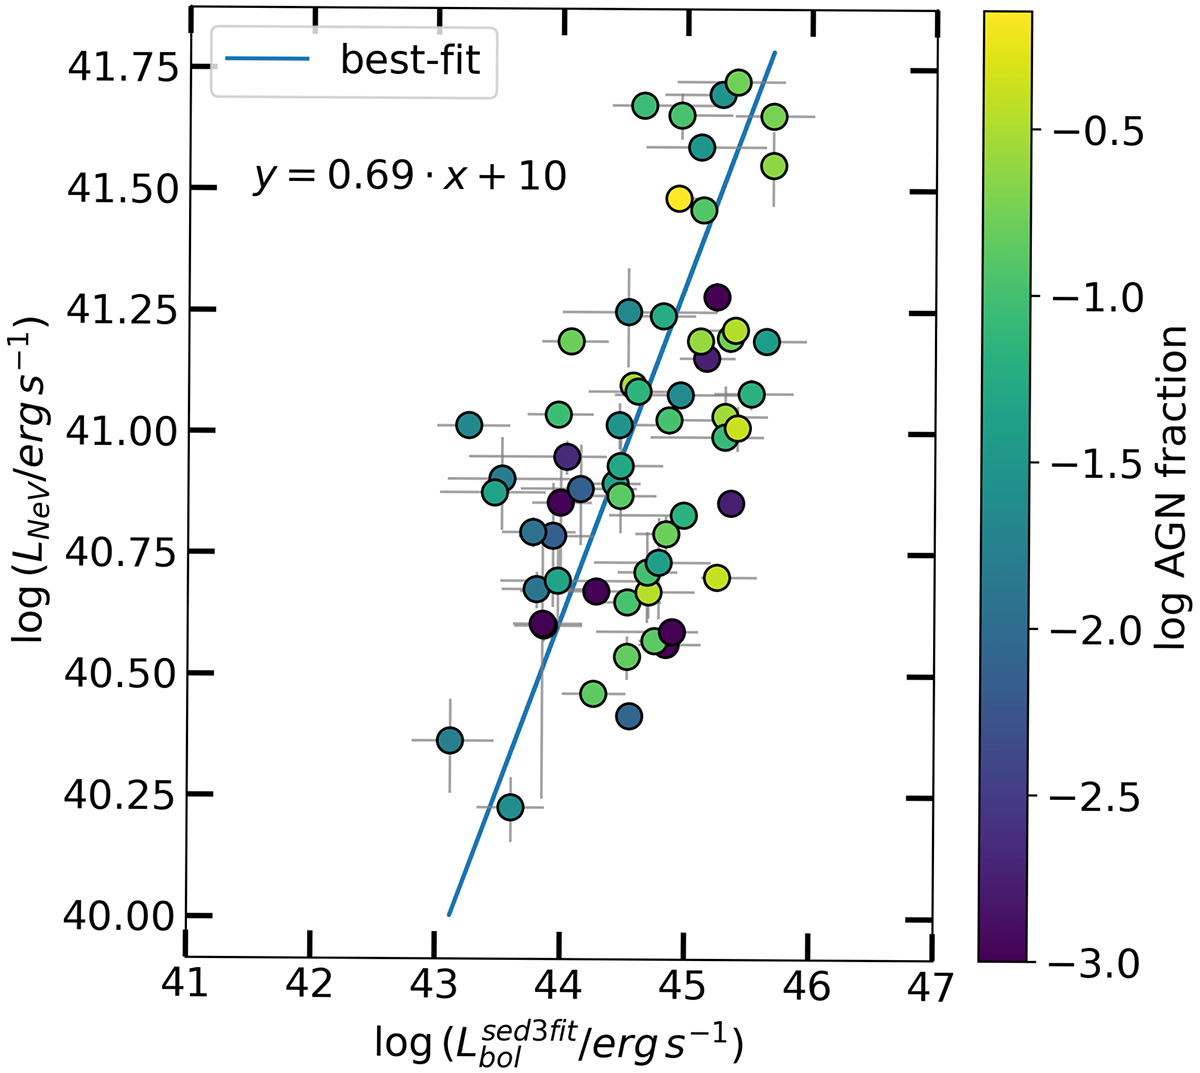
Luminosity of the [Ne V] line as a function of the AGN bolometric luminosity obtained from the SED-fit. We excluded the 18 sources with only upper limits on their ![]() . The blue line is the best-fit relation obtained via an orthogonal distance regression. The [Ne V] sources are colour coded on the basis of their AGN fraction measured in the 8 − 1000 μm wavelength range.
. The blue line is the best-fit relation obtained via an orthogonal distance regression. The [Ne V] sources are colour coded on the basis of their AGN fraction measured in the 8 − 1000 μm wavelength range.
Current usage metrics show cumulative count of Article Views (full-text article views including HTML views, PDF and ePub downloads, according to the available data) and Abstracts Views on Vision4Press platform.
Data correspond to usage on the plateform after 2015. The current usage metrics is available 48-96 hours after online publication and is updated daily on week days.
Initial download of the metrics may take a while.