Fig. 4.
Download original image
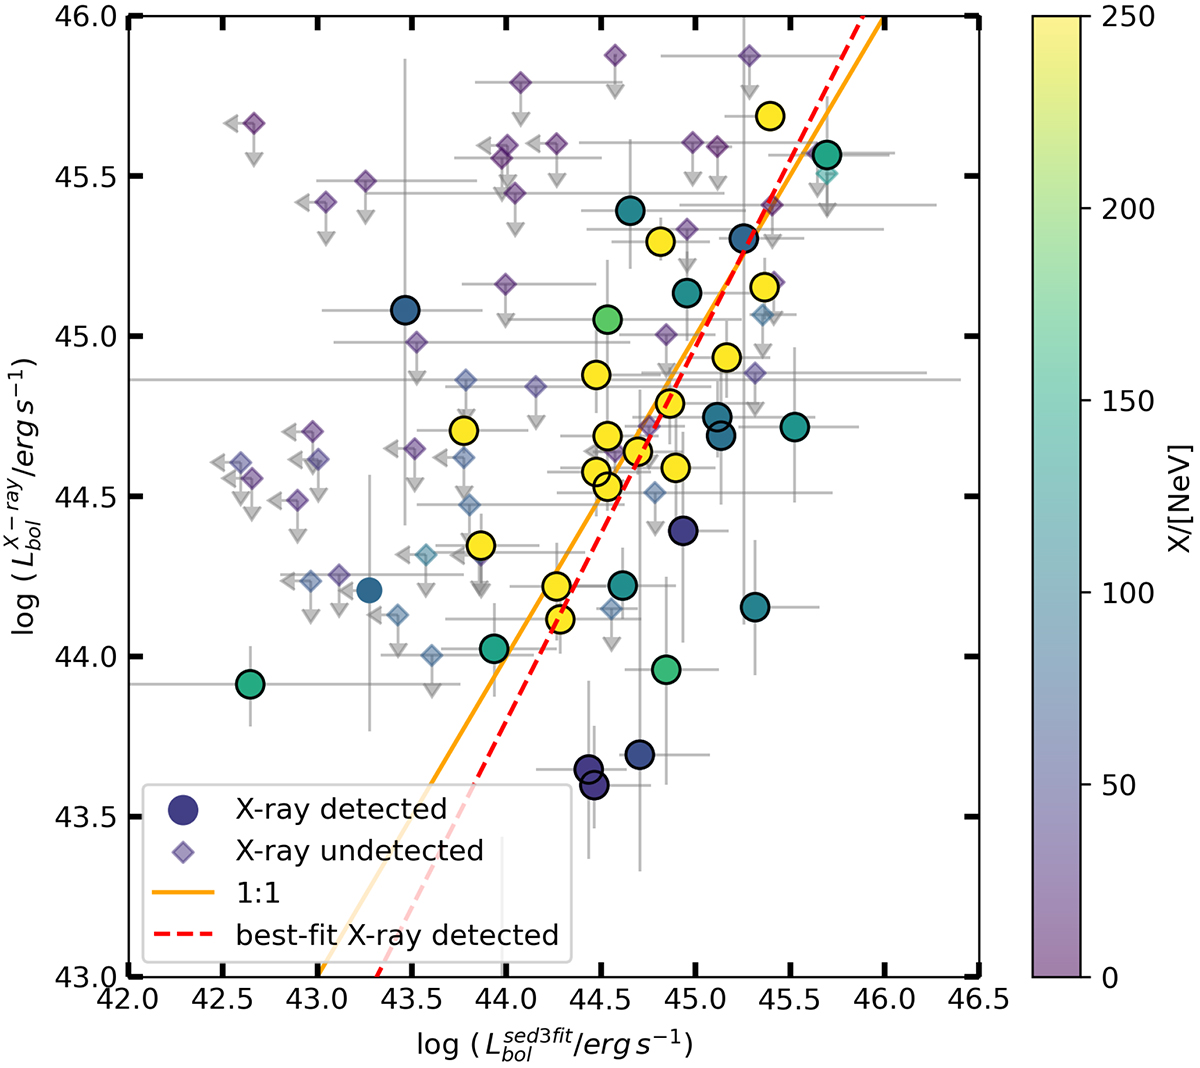
Comparison of the AGN bolometric luminosities obtained from the SED-fitting (![]() ) and from X-ray spectral analysis (
) and from X-ray spectral analysis (![]() ). The
). The ![]() were computed from the 2 − 10 keV rest-frame intrinsic luminosities using the Lusso et al. (2012) bolometric correction. Circles indicate X-ray-detected sources, while diamonds are the X-ray-undetected. For these sources, we have only an upper limit on their
were computed from the 2 − 10 keV rest-frame intrinsic luminosities using the Lusso et al. (2012) bolometric correction. Circles indicate X-ray-detected sources, while diamonds are the X-ray-undetected. For these sources, we have only an upper limit on their ![]() . The color code indicates the X/[Ne V] ratio for the X-ray-detected sources and upper limits for the X-ray-undetected sources. The orange line is the 1:1 correlation. The red line is the best-fit relation for the X-ray-detected sources obtained via orthogonal distance regression.
. The color code indicates the X/[Ne V] ratio for the X-ray-detected sources and upper limits for the X-ray-undetected sources. The orange line is the 1:1 correlation. The red line is the best-fit relation for the X-ray-detected sources obtained via orthogonal distance regression.
Current usage metrics show cumulative count of Article Views (full-text article views including HTML views, PDF and ePub downloads, according to the available data) and Abstracts Views on Vision4Press platform.
Data correspond to usage on the plateform after 2015. The current usage metrics is available 48-96 hours after online publication and is updated daily on week days.
Initial download of the metrics may take a while.