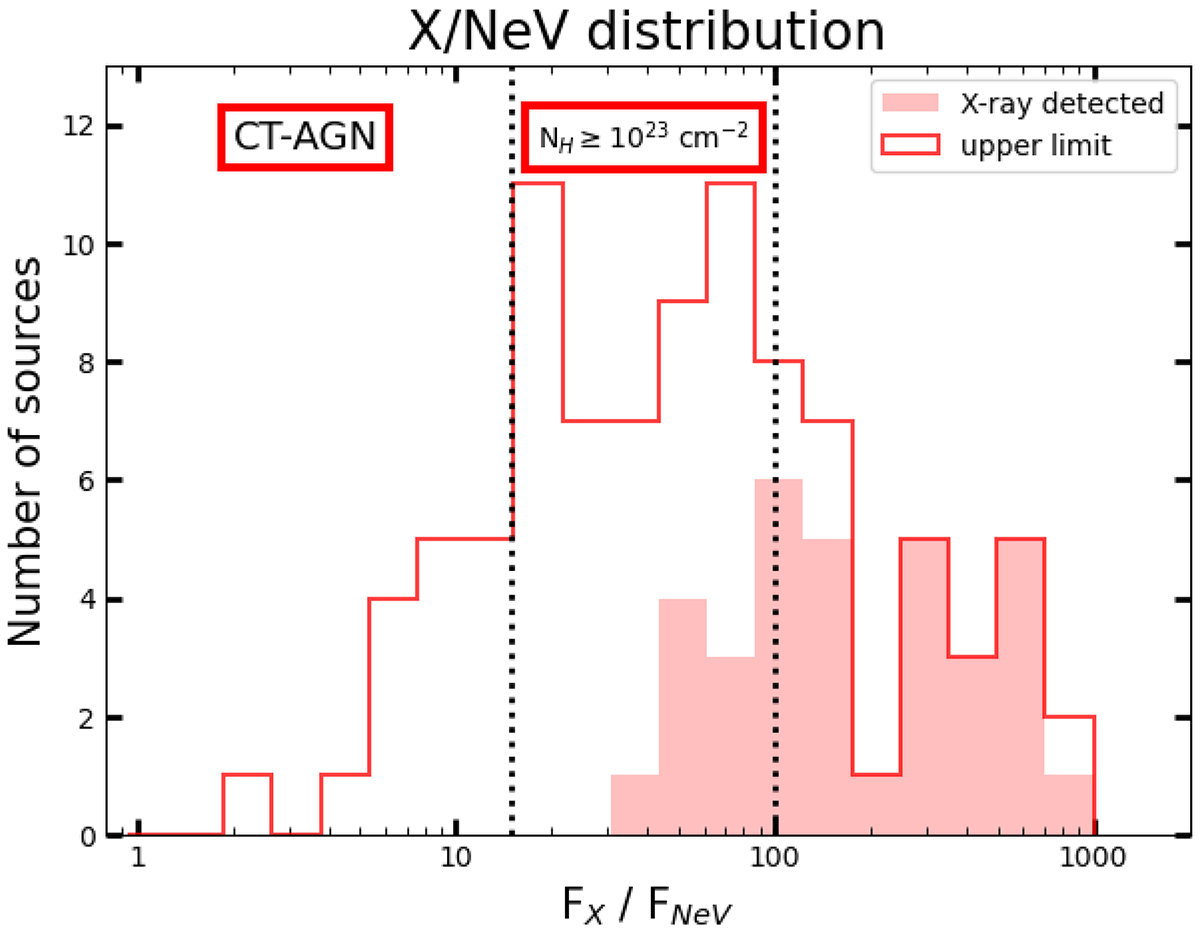
Fig. 2.
Download original image
X/[Ne V] ratio distribution. Filled and empty histograms refer to X-ray detections and upper limits, respectively. The leftward area (X/[Ne V] ≤ 15) is the region defined by Gilli et al. (2010) for Compton-thick AGNs, while the central area (15 < X/[Ne V] ≤ 100) is where very obscured (NH > 1023 cm−2) and possible CT-AGNs should be located.
Current usage metrics show cumulative count of Article Views (full-text article views including HTML views, PDF and ePub downloads, according to the available data) and Abstracts Views on Vision4Press platform.
Data correspond to usage on the plateform after 2015. The current usage metrics is available 48-96 hours after online publication and is updated daily on week days.
Initial download of the metrics may take a while.