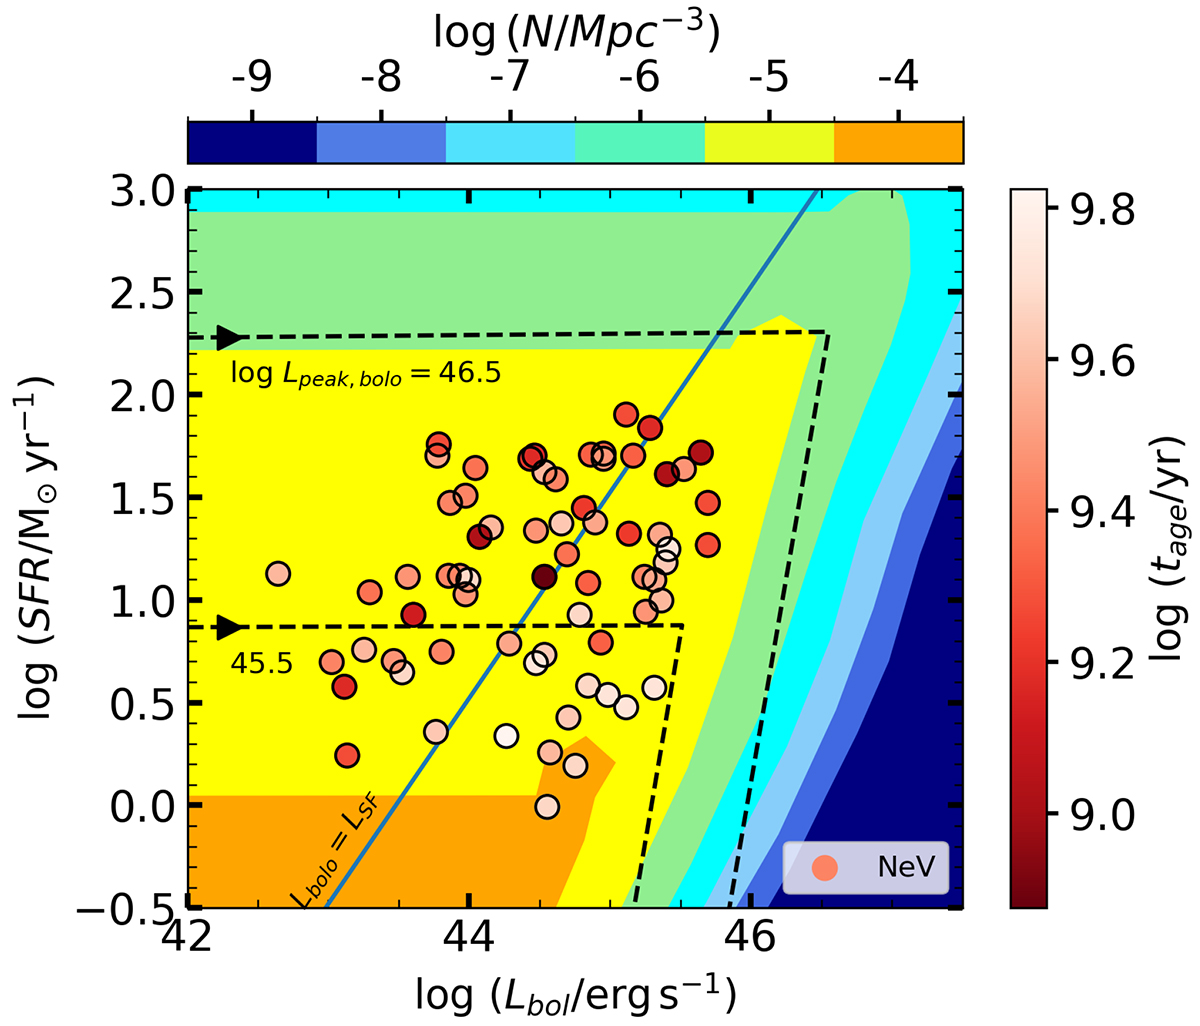
Fig. 13.
Download original image
Distribution of the [Ne V] sources on the SFR–Lbol plane. The color code indicates the age of the oldest stars in the host galaxy, as provided by sed3fit. Colored contours illustrate the number density of galaxies plus AGN at z ∼ 1 as predicted by the in situ co-evolution model (Mancuso et al. 2016a); orange, yellow, green, cyan, light blue, blue, and dark blue contours refer to number density of 10−4, 10−5, 10−6, 10−7, 10−8, 10−9 Mpc−1, respectively. The black dashed lines show two evolutionary tracks (forward time direction indicated by the arrows) for AGNs with peak bolometric luminosity of 1045.5 and 1046.5 erg s−1. The blue continuous line indicates where the SF luminosity is equal to the AGN luminosity. The average uncertainty on the tage is ∼0.1 dex.
Current usage metrics show cumulative count of Article Views (full-text article views including HTML views, PDF and ePub downloads, according to the available data) and Abstracts Views on Vision4Press platform.
Data correspond to usage on the plateform after 2015. The current usage metrics is available 48-96 hours after online publication and is updated daily on week days.
Initial download of the metrics may take a while.