Fig. 1.
Download original image
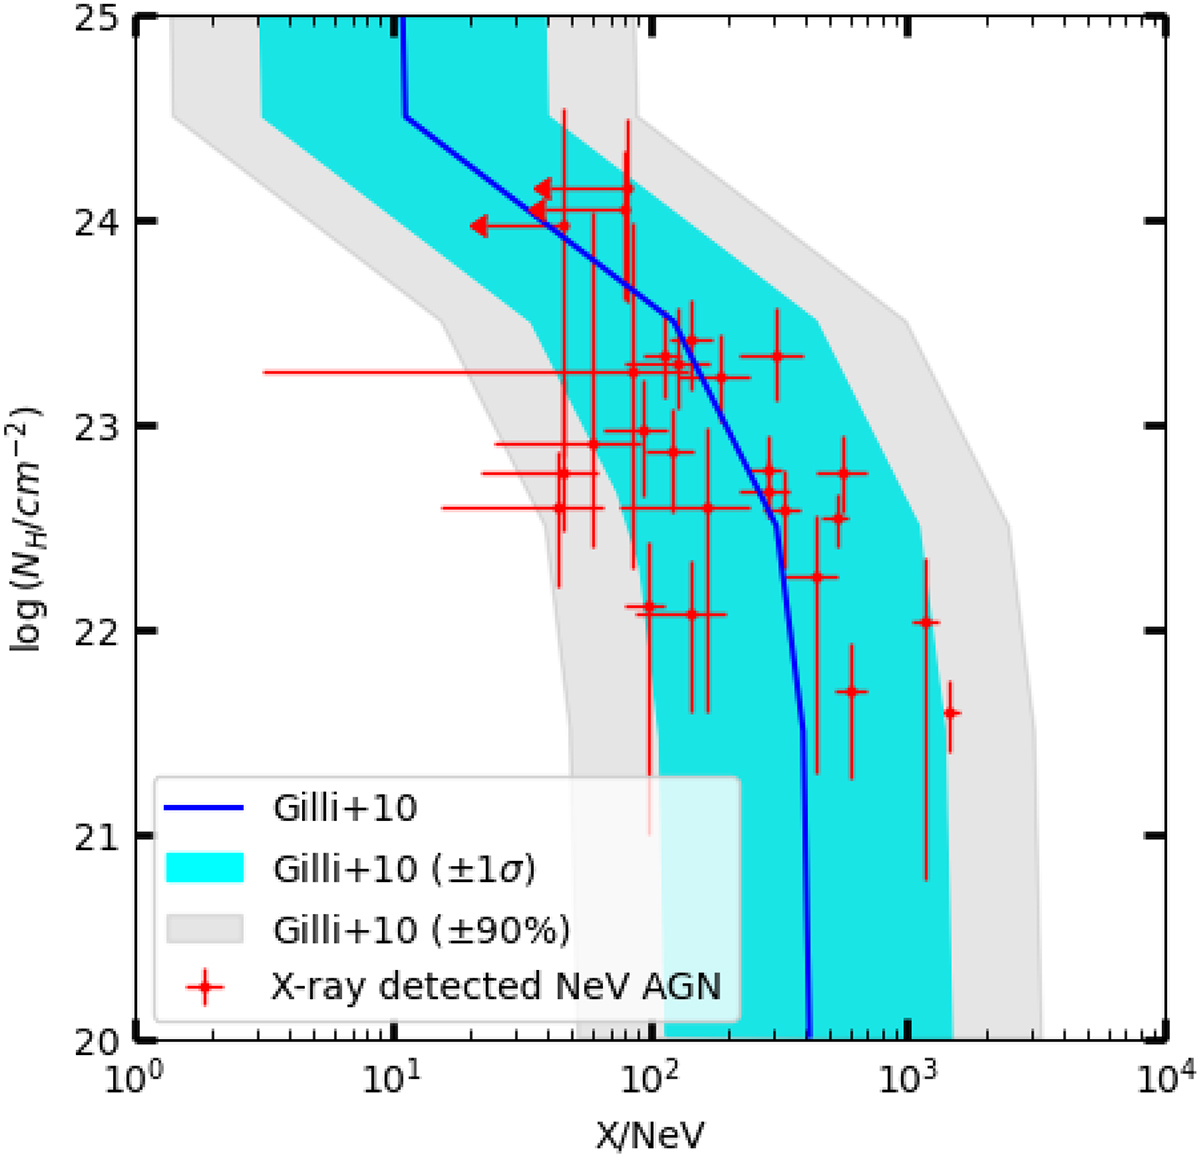
X/[Ne V] vs. NH diagram. Red dots are the X-ray-detected sources of the [Ne V] sample, with NH obtained from the X-ray spectral analysis. The solid line shows the expected X/[Ne V] values as a function of absorption, as computed by Gilli et al. (2010, but see also Cleri et al. 2023) using spectral templates with different NH, starting from the mean X/[Ne V] obtained from a sample of unobscured Seyfert galaxies. The cyan shaded region was computed in the same way, but starting from the mean X/[Ne V] ±1σ and the grey shaded region starting from the mean X/[Ne V] ±90%. The [Ne V] sample populates the obscured AGN region of the diagram, i.e., NH ≳ 1022 cm−2.
Current usage metrics show cumulative count of Article Views (full-text article views including HTML views, PDF and ePub downloads, according to the available data) and Abstracts Views on Vision4Press platform.
Data correspond to usage on the plateform after 2015. The current usage metrics is available 48-96 hours after online publication and is updated daily on week days.
Initial download of the metrics may take a while.