Fig. 7
Download original image
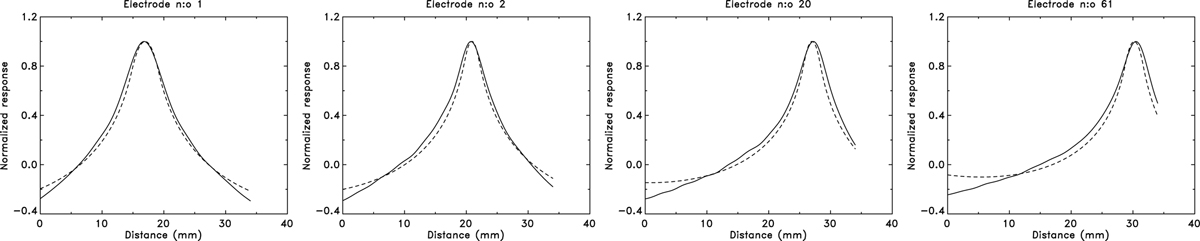
Vertical cross sections of the response for four of the electrode influence functions shown in Fig. 6. The full curve shows the response obtained from the calibration of the DM with the 253-lenslet SH, and the dashed curve shows the response obtained from theoretical simulations. All curves have been normalized to unity at the peak values of the corresponding plot. The numbering of the electrodes is explained in Fig. 6.
Current usage metrics show cumulative count of Article Views (full-text article views including HTML views, PDF and ePub downloads, according to the available data) and Abstracts Views on Vision4Press platform.
Data correspond to usage on the plateform after 2015. The current usage metrics is available 48-96 hours after online publication and is updated daily on week days.
Initial download of the metrics may take a while.