Fig. 6
Download original image
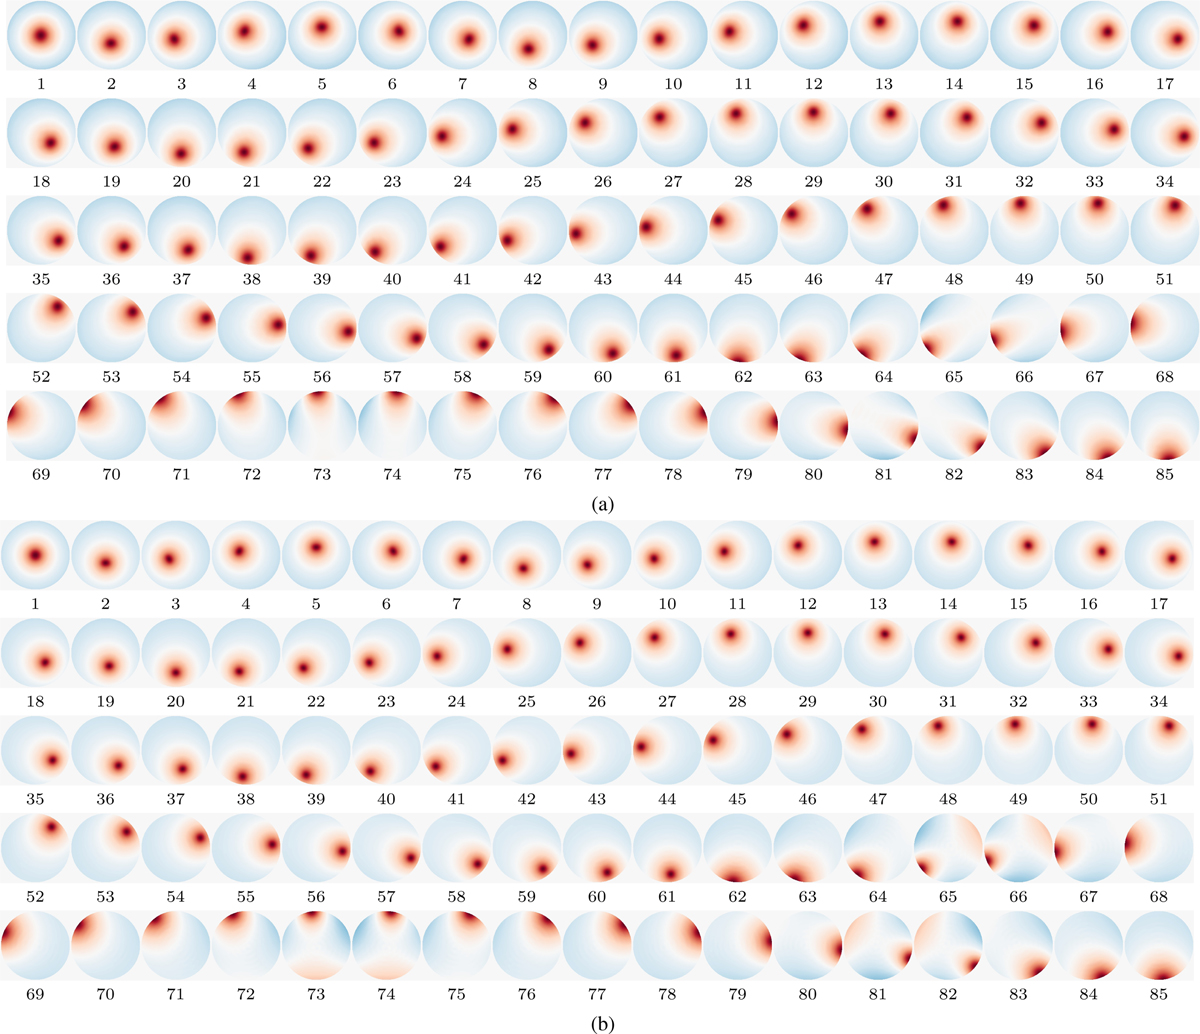
85-electrode influence functions, Ei(r, θ). The influence functions (see Appendix A) correspond to the matrix Ch (see text). Panel a shows this as obtained from the calibration of the DM using sunlight on a pinhole located in front of the DM, and monitoring the measured pinhole positions from the 253-lenslet SH WFS, shown in Fig. 2, while the AO computer outputs a saw-tooth voltage on one electrode at the time. Panel b shows the same influence functions as calculated theoretically from the electrode layout and the thin-plate model (implemented as the solution to the Poisson equation, taking into account the three mounting points of the DM). The color-scaling in the upper panel is consistent with that in the lower panel.
Current usage metrics show cumulative count of Article Views (full-text article views including HTML views, PDF and ePub downloads, according to the available data) and Abstracts Views on Vision4Press platform.
Data correspond to usage on the plateform after 2015. The current usage metrics is available 48-96 hours after online publication and is updated daily on week days.
Initial download of the metrics may take a while.