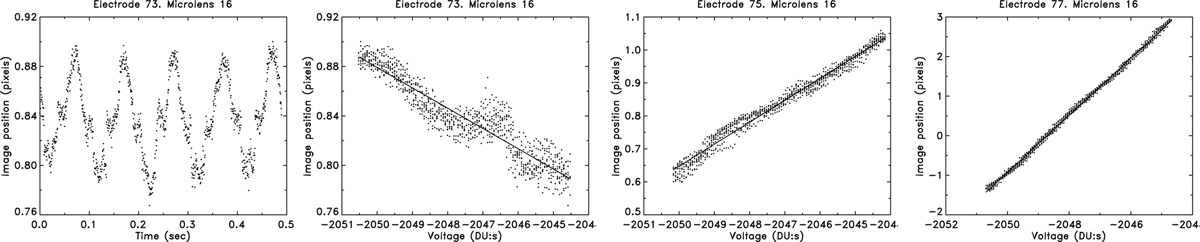
Fig. 5
Download original image
DM control matrix calibration. Shown are measured positions of the pinhole image from subimage 16 (out of 253) as response to the 10 Hz saw-tooth wave of voltages applied to electrodes 73, 75, and 77. The amplitude response to electrode 73 results in a movement of only ±0.06 pixels or 0″.703, but the saw-tooth wave of the image positions is well above the noise level. The numbering of the electrodes is explained in Fig. 6, and their relations to microlens 16 are indicated in Fig. 2.
Current usage metrics show cumulative count of Article Views (full-text article views including HTML views, PDF and ePub downloads, according to the available data) and Abstracts Views on Vision4Press platform.
Data correspond to usage on the plateform after 2015. The current usage metrics is available 48-96 hours after online publication and is updated daily on week days.
Initial download of the metrics may take a while.