Fig. 10
Download original image
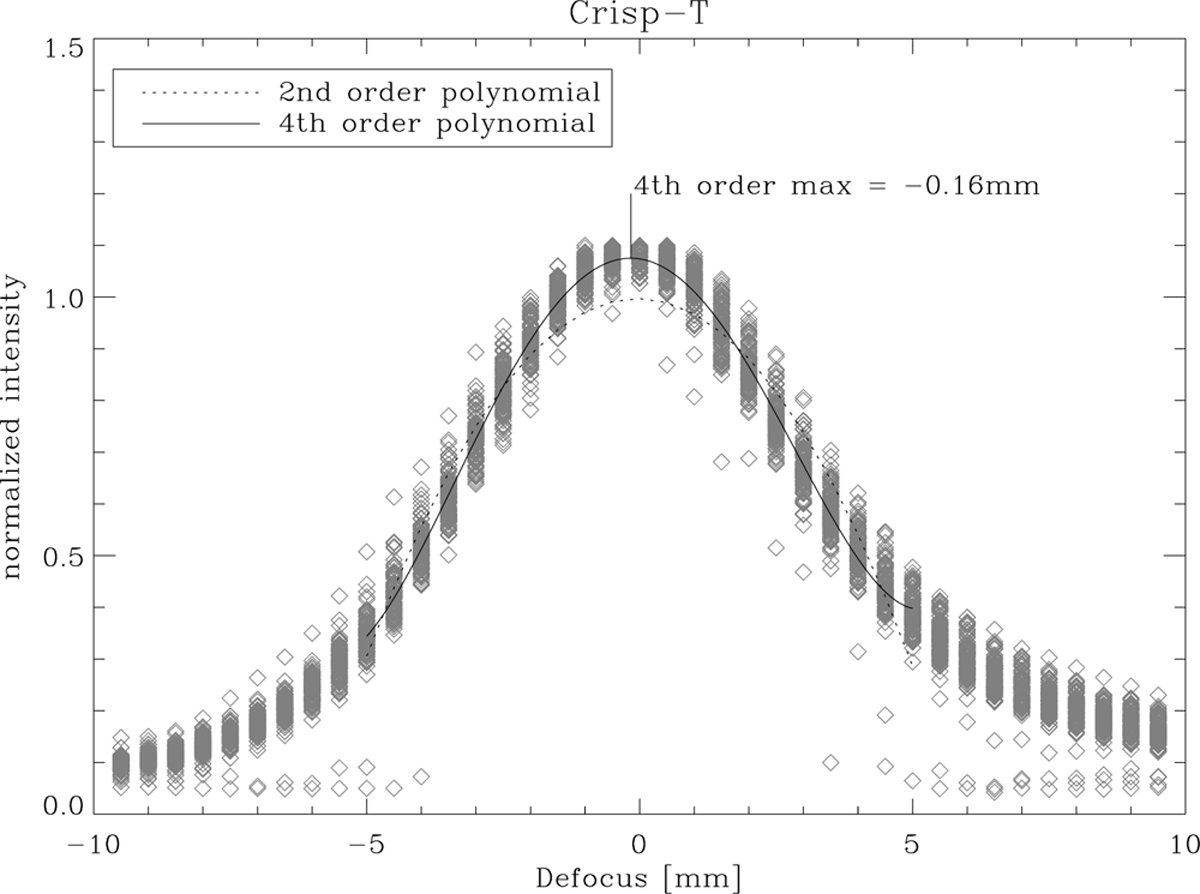
Focus plot for one of the CRISP narrowband cameras. The plot shows data from all 121 pinholes within the FOV. A few of the pinholes are partly blocked, resulting in the outliers shown. The remaining data are fit to a fourth-order polynomial that results in a best-fit focus position of −0.16 mm. A second-order polynomial provides a much poorer fit to the data, but the resulting focus position is almost the same, −0.04 mm. It is estimated that the accuracy of the method is better than ±0.3 mm.
Current usage metrics show cumulative count of Article Views (full-text article views including HTML views, PDF and ePub downloads, according to the available data) and Abstracts Views on Vision4Press platform.
Data correspond to usage on the plateform after 2015. The current usage metrics is available 48-96 hours after online publication and is updated daily on week days.
Initial download of the metrics may take a while.