Open Access
Fig. 3.
Download original image
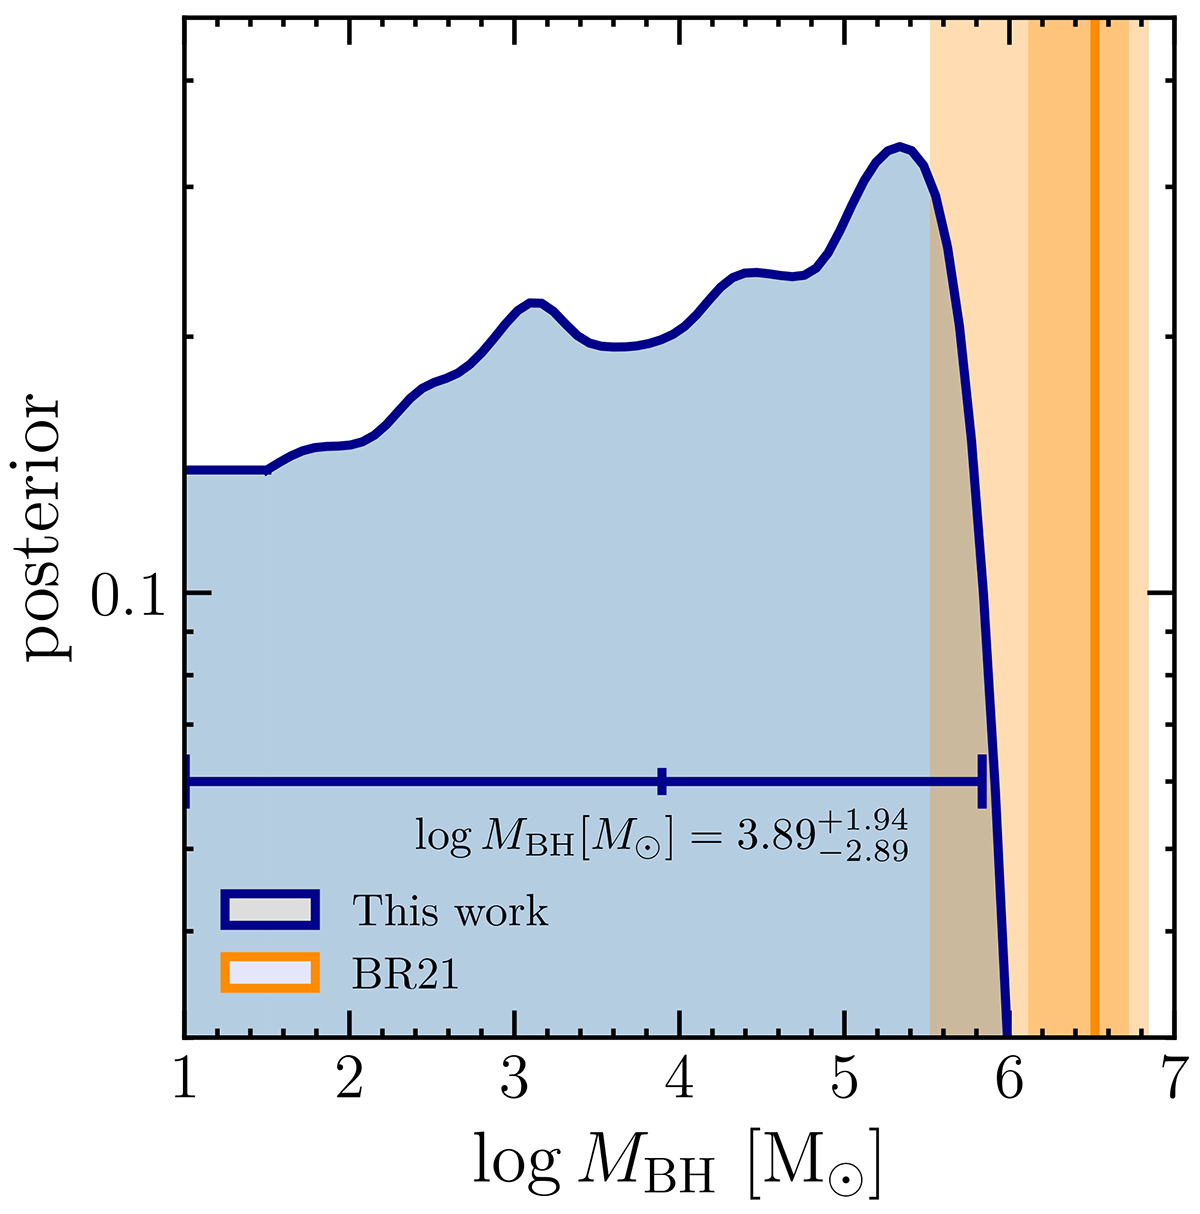
Posterior distribution on the logarithm of the BH mass, log MBH (represented by the blue curve). The blue horizontal bar shows the 3σ confidence interval. The posterior is compared with the best model and with the 1σ and 3σ estimates from BR21 (shown by the solid orange line and bands).
Current usage metrics show cumulative count of Article Views (full-text article views including HTML views, PDF and ePub downloads, according to the available data) and Abstracts Views on Vision4Press platform.
Data correspond to usage on the plateform after 2015. The current usage metrics is available 48-96 hours after online publication and is updated daily on week days.
Initial download of the metrics may take a while.