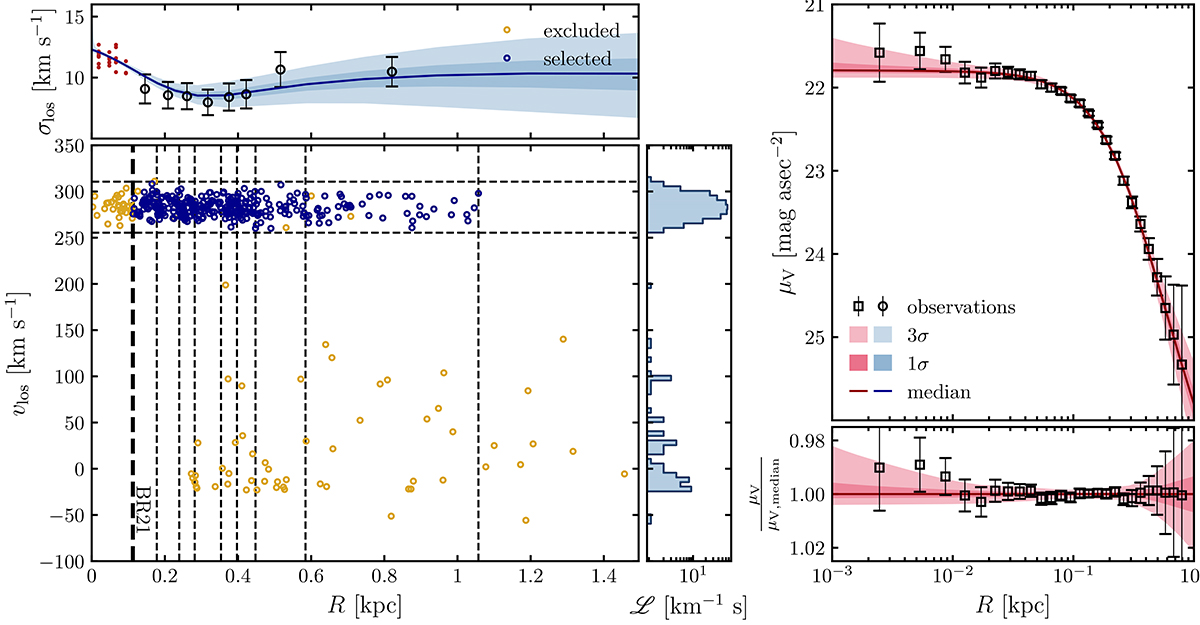
Fig. 1.
Download original image
Comparison between data and models. Bottom left: kinematic sample from M08. In blue (gold), we show stars included in (excluded from) our analysis. Top left: derived los velocity dispersion profile. The bins’ edges are indicated by vertical dashed lines in the bottom-left panel. The red points represent the los velocity dispersions computed from the LOSVDs shown in Fig. 2. Middle panel: marginalized velocity distribution. Top right: surface brightness profile from BR21. Bottom right: model residuals compared to the data. The light (dark) blue and red bands represent the models’ 1σ (3σ) confidence intervals, while the solid curves are median models.
Current usage metrics show cumulative count of Article Views (full-text article views including HTML views, PDF and ePub downloads, according to the available data) and Abstracts Views on Vision4Press platform.
Data correspond to usage on the plateform after 2015. The current usage metrics is available 48-96 hours after online publication and is updated daily on week days.
Initial download of the metrics may take a while.