Fig. 1
Download original image
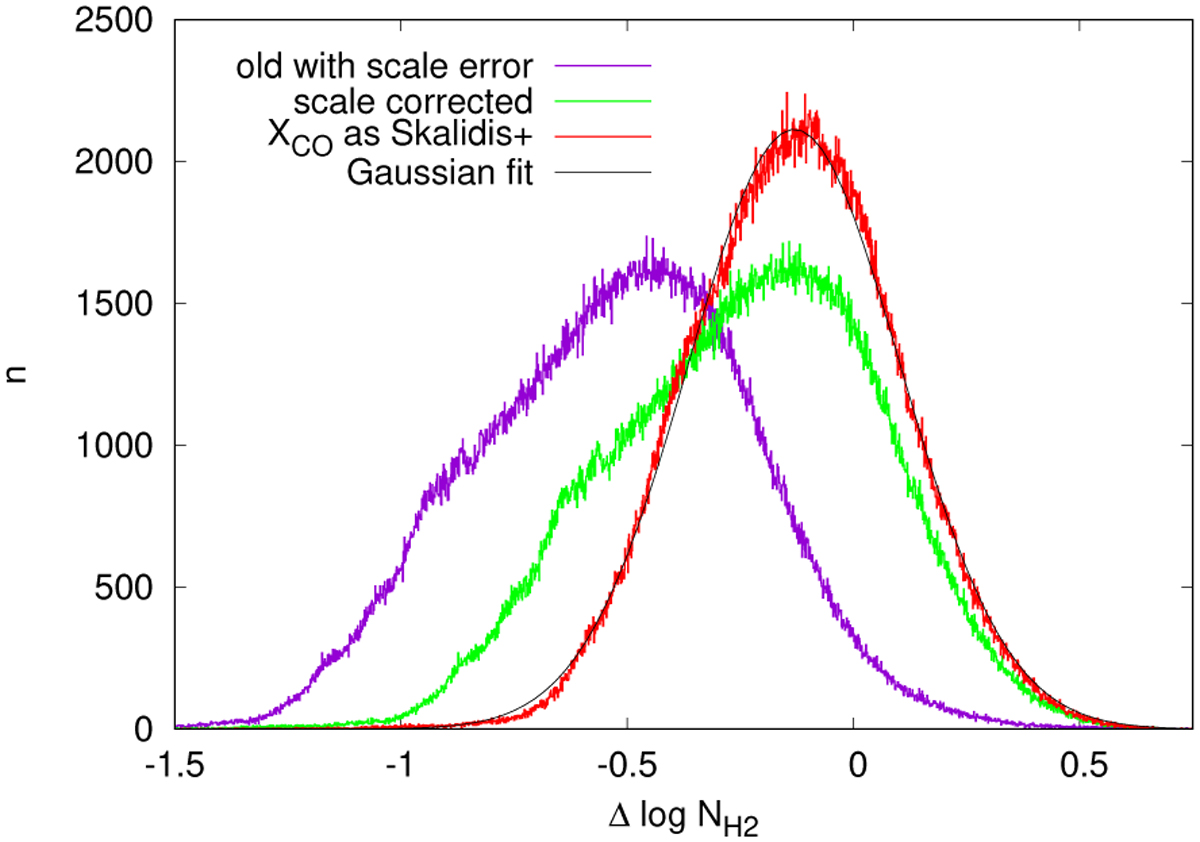
Distribution of differences ∆(log NH2) according to Skalidis et al. (2024, Eq. (8)) for three casses: blue, initial NH2 data from Kalberla et al. (2020a) with a scale error; green, scale error corrected; and red, scale error corrected and using XCO = 2 × 1020 cm−2 (K km s−1)−1.
Current usage metrics show cumulative count of Article Views (full-text article views including HTML views, PDF and ePub downloads, according to the available data) and Abstracts Views on Vision4Press platform.
Data correspond to usage on the plateform after 2015. The current usage metrics is available 48-96 hours after online publication and is updated daily on week days.
Initial download of the metrics may take a while.