Fig. A.4.
Download original image
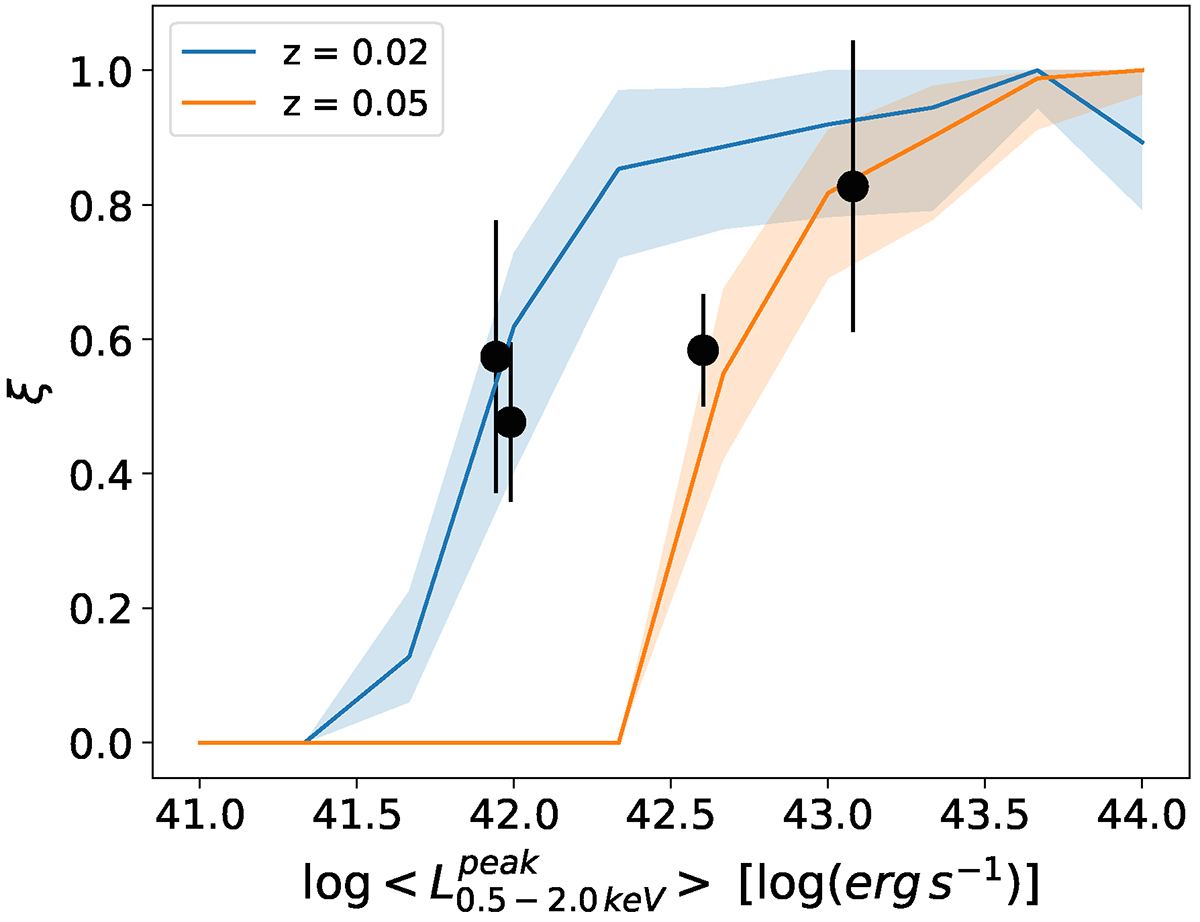
Simulated detection efficiency ξ as a function of peak luminosity ![]() in the redshift bin z = 0.02 (blue) and z = 0.05 (orange). The plot is a version of Fig. A.3 collapsed on the y-axis. The black points indicate the known eROSITA QPEs (A21,A24). They are representative of the ξ values of the simulated population at their respective luminosity.
in the redshift bin z = 0.02 (blue) and z = 0.05 (orange). The plot is a version of Fig. A.3 collapsed on the y-axis. The black points indicate the known eROSITA QPEs (A21,A24). They are representative of the ξ values of the simulated population at their respective luminosity.
Current usage metrics show cumulative count of Article Views (full-text article views including HTML views, PDF and ePub downloads, according to the available data) and Abstracts Views on Vision4Press platform.
Data correspond to usage on the plateform after 2015. The current usage metrics is available 48-96 hours after online publication and is updated daily on week days.
Initial download of the metrics may take a while.