Fig. A.3.
Download original image
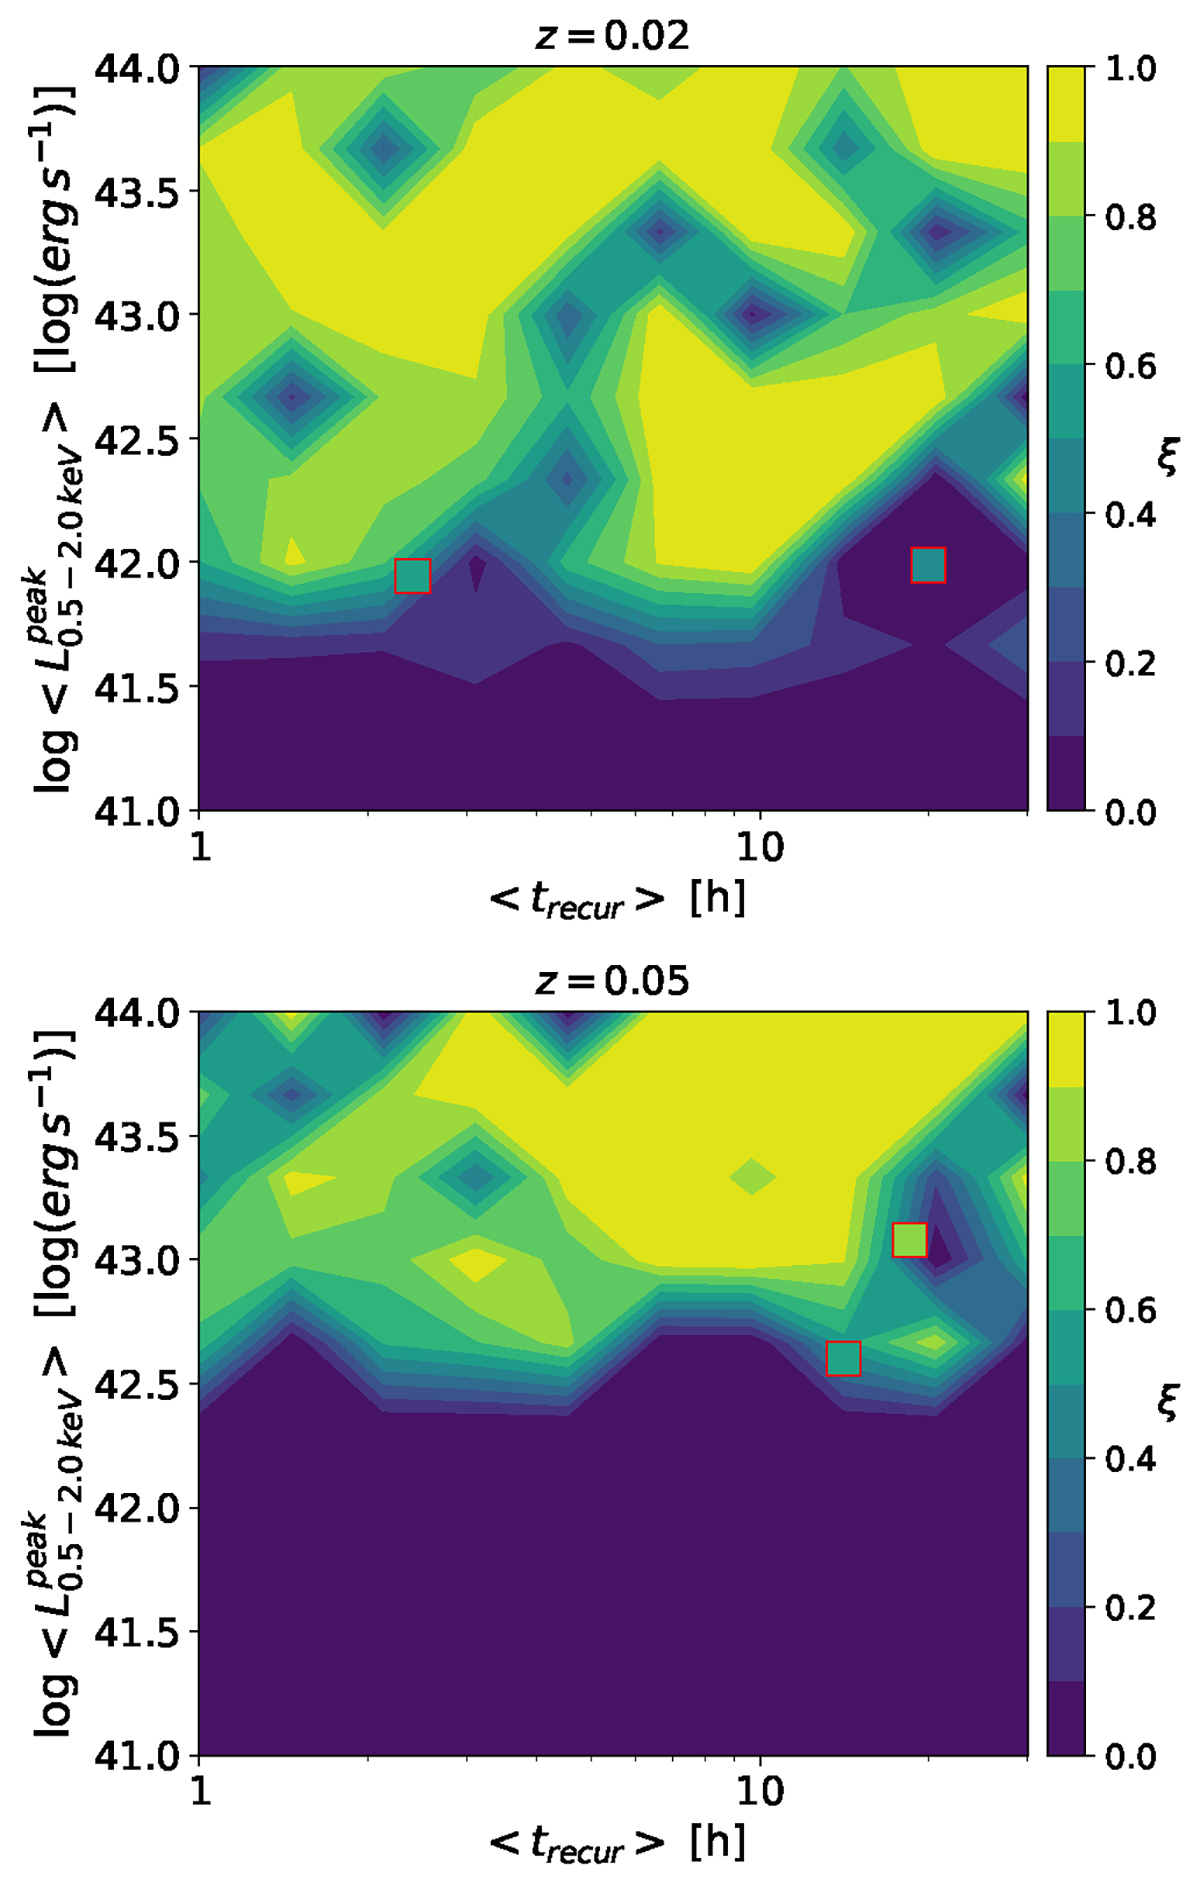
Maps of the simulated eROSITA detection efficiency ξ for QPE sources in a 2D grid of average peak luminosity (![]() ) and average recurrence time (⟨trecur⟩), for the case of z = 0.02 (top) and z = 0.05 (bottom). Squares with a red contour highlight the known QPE sources in the respective redshift bins. Apart from the grid points around the periods resonating with eROSITA’s 4 h cadence, ξ is fairly homogeneous above the cut provided by the sensitivity of each redshift bin.
) and average recurrence time (⟨trecur⟩), for the case of z = 0.02 (top) and z = 0.05 (bottom). Squares with a red contour highlight the known QPE sources in the respective redshift bins. Apart from the grid points around the periods resonating with eROSITA’s 4 h cadence, ξ is fairly homogeneous above the cut provided by the sensitivity of each redshift bin.
Current usage metrics show cumulative count of Article Views (full-text article views including HTML views, PDF and ePub downloads, according to the available data) and Abstracts Views on Vision4Press platform.
Data correspond to usage on the plateform after 2015. The current usage metrics is available 48-96 hours after online publication and is updated daily on week days.
Initial download of the metrics may take a while.