Fig. A.2.
Download original image
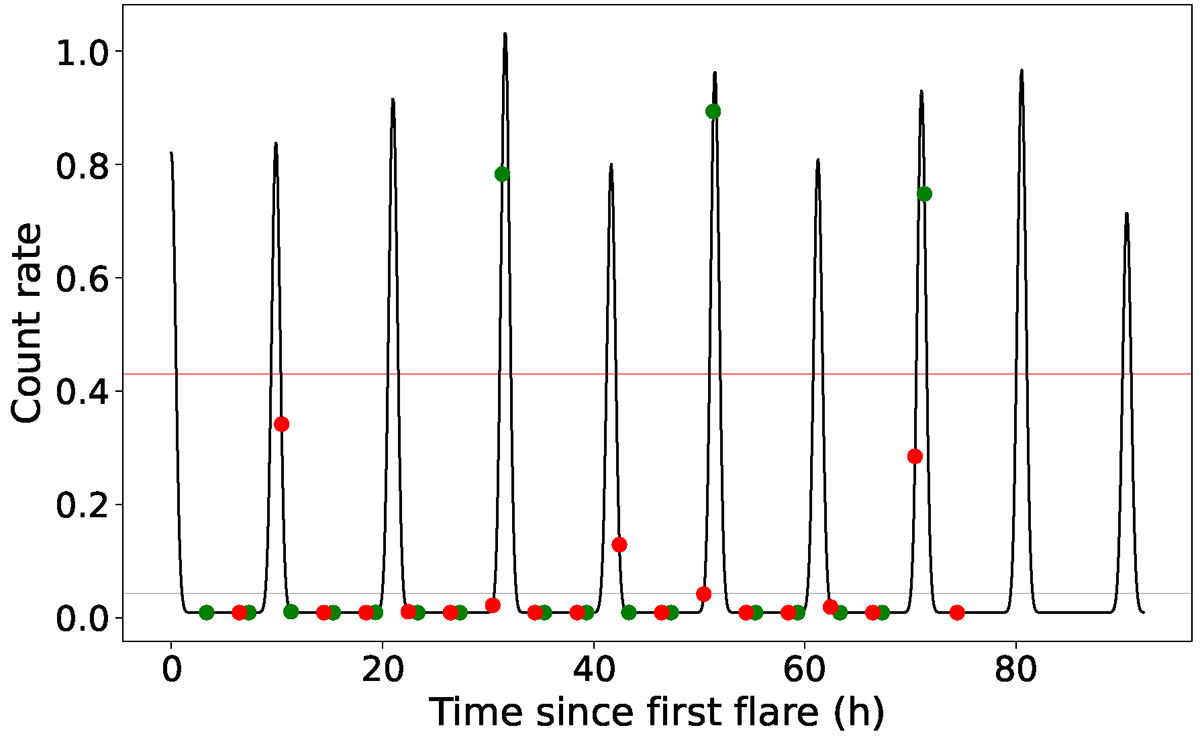
Example of simulated light curve, drawn from ![]() and ⟨trecur⟩∼10 h within their 10% scatter, and ⟨tdur⟩∼1 h (from the relation in the bottom panel of Fig. A.1). An example of a successful (green points) and an unsuccessful (red) mock eROSITA scan is shown. The red line shows the eRASS sensitivity for bright states, the gray shows the threshold for faint states used in the simulations.
and ⟨trecur⟩∼10 h within their 10% scatter, and ⟨tdur⟩∼1 h (from the relation in the bottom panel of Fig. A.1). An example of a successful (green points) and an unsuccessful (red) mock eROSITA scan is shown. The red line shows the eRASS sensitivity for bright states, the gray shows the threshold for faint states used in the simulations.
Current usage metrics show cumulative count of Article Views (full-text article views including HTML views, PDF and ePub downloads, according to the available data) and Abstracts Views on Vision4Press platform.
Data correspond to usage on the plateform after 2015. The current usage metrics is available 48-96 hours after online publication and is updated daily on week days.
Initial download of the metrics may take a while.