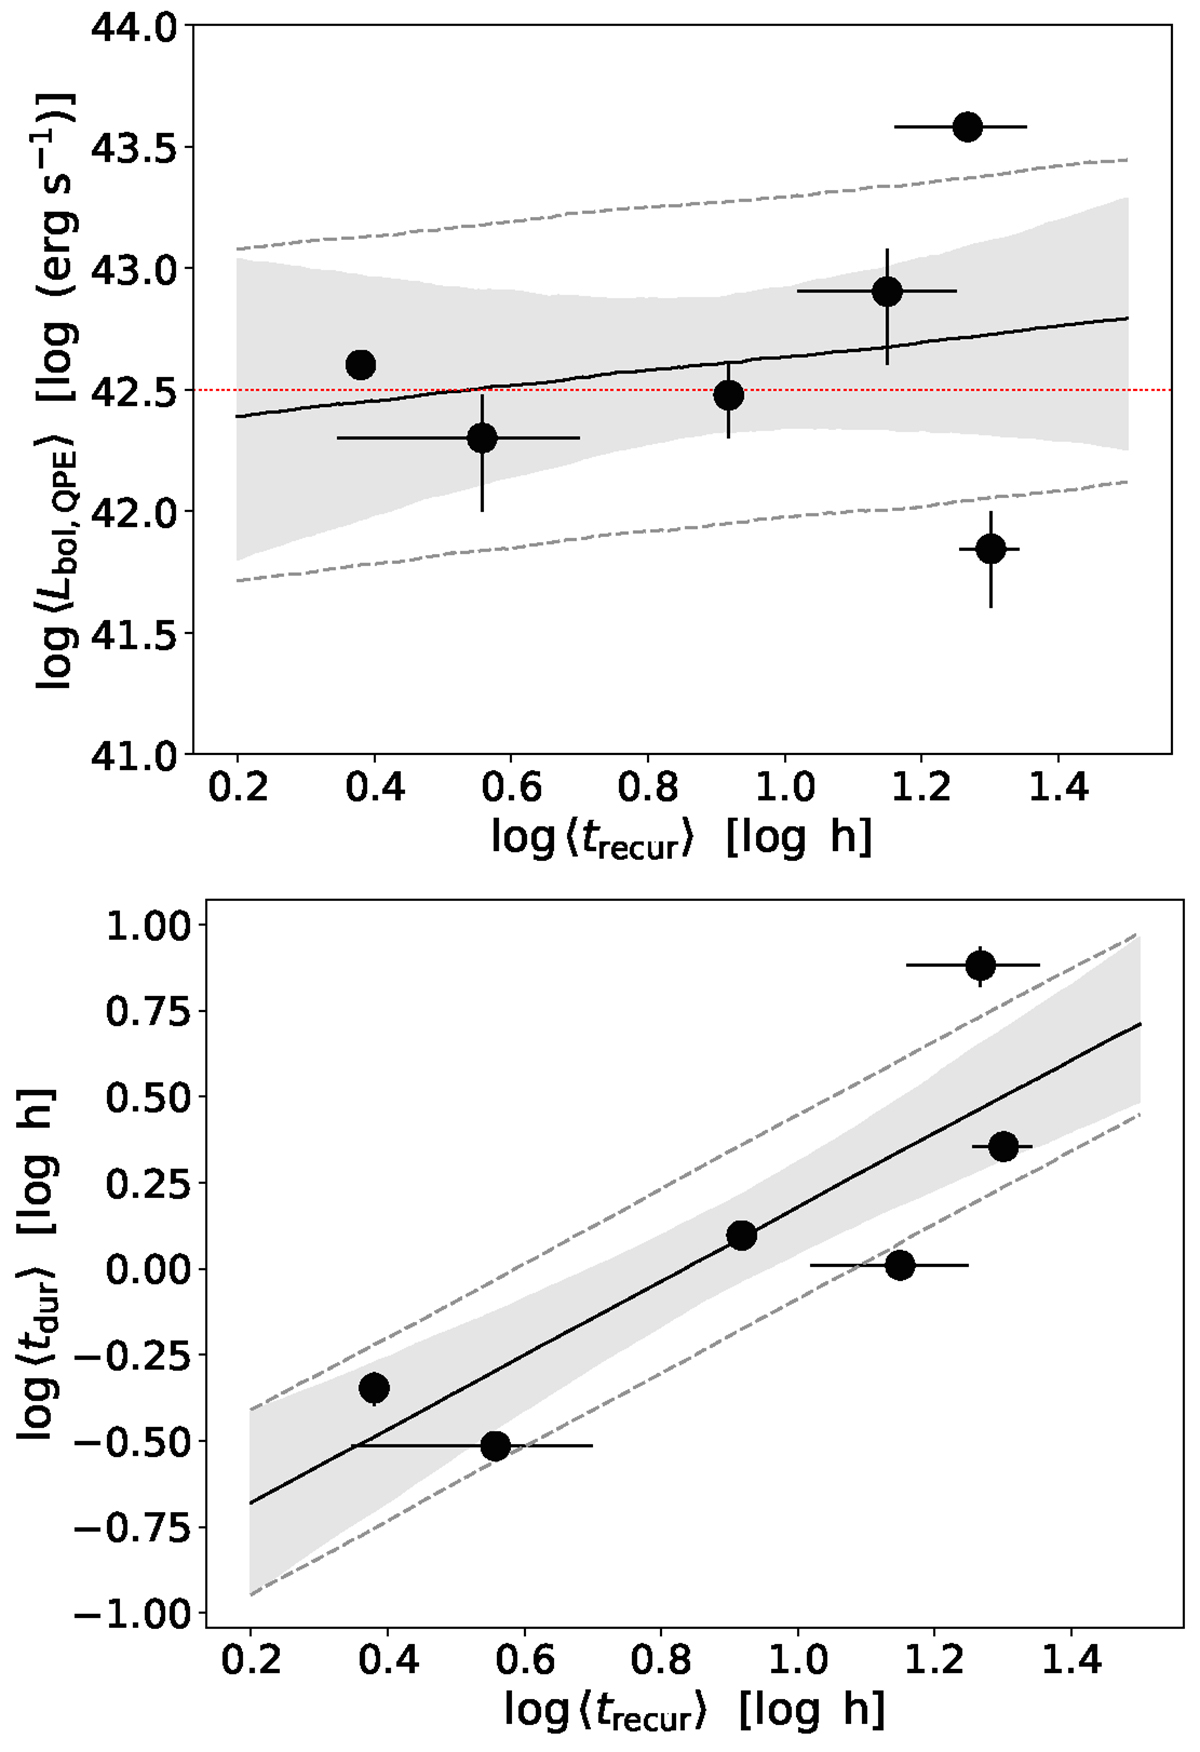
Fig. A.1.
Download original image
Relation between average recurrence time (trecur) and average peak X-ray luminosity (top panel) or average eruption duration (tdur, bottom panel) in QPE sources. The data is from Fig. 13 in A24. In the top panel the slope is consistent with zero (red dotted line), and thus with quantities being uncorrelated given the available data. In the bottom panel the slope is consistent with being linear in the log-log plane.
Current usage metrics show cumulative count of Article Views (full-text article views including HTML views, PDF and ePub downloads, according to the available data) and Abstracts Views on Vision4Press platform.
Data correspond to usage on the plateform after 2015. The current usage metrics is available 48-96 hours after online publication and is updated daily on week days.
Initial download of the metrics may take a while.