Fig. 2.

Download original image
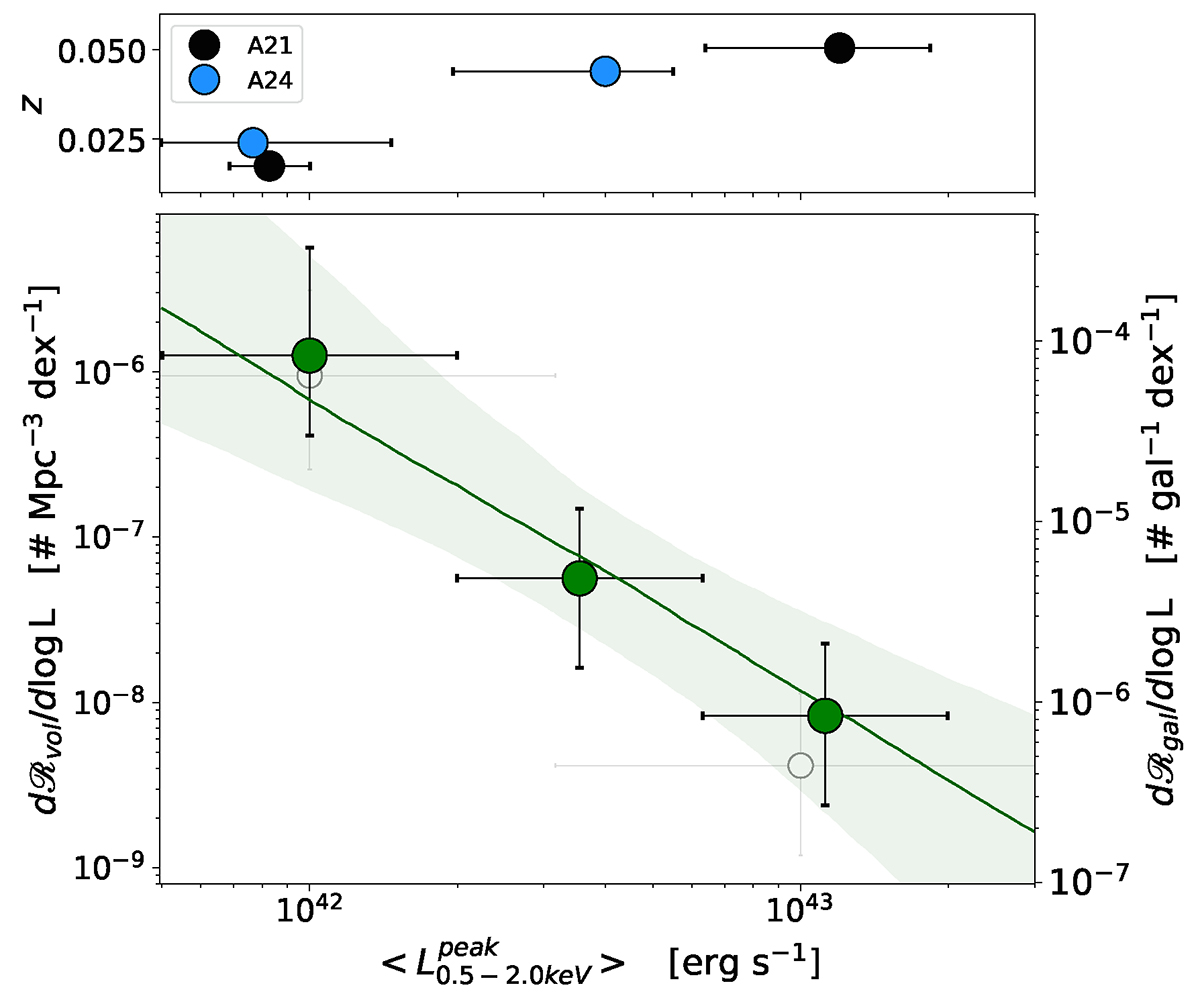
QPEs volumetric rates. Top: Distribution of the four eROSITA QPEs (A21; A24) in the luminosity-redshift plane. Bottom: X-ray luminosity function of eROSITA QPEs (green), expressed both in Mpc−3 and per galaxy, as a function of the average peak 0.5 − 2.0 keV luminosity. The three bins adopted in ![]() are 41.7 − 42.3, 42.3 − 42.8 and 42.8 − 43.3, respectively containing two, one and one QPE. The green line and related contours represent the median and 16th–84th percentiles of the fit power-law model, with a slope ≈ − 2. The two gray points represent the rates from eRO-QPE1 and eRO-QPE2 alone (A21) in two bins of 1 dex, to highlight the small effect of adding new discoveries.
are 41.7 − 42.3, 42.3 − 42.8 and 42.8 − 43.3, respectively containing two, one and one QPE. The green line and related contours represent the median and 16th–84th percentiles of the fit power-law model, with a slope ≈ − 2. The two gray points represent the rates from eRO-QPE1 and eRO-QPE2 alone (A21) in two bins of 1 dex, to highlight the small effect of adding new discoveries.
Current usage metrics show cumulative count of Article Views (full-text article views including HTML views, PDF and ePub downloads, according to the available data) and Abstracts Views on Vision4Press platform.
Data correspond to usage on the plateform after 2015. The current usage metrics is available 48-96 hours after online publication and is updated daily on week days.
Initial download of the metrics may take a while.


