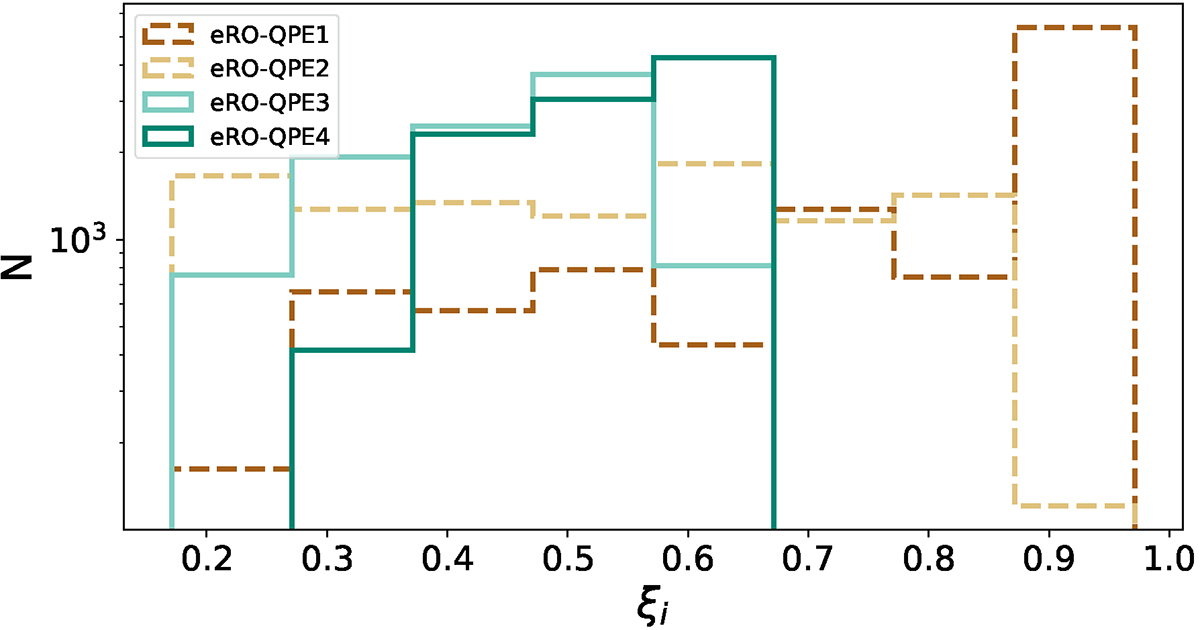
Fig. 1.
Download original image
Histograms of the distribution of detection efficiency (ξ) of the QPE sources discovered by eROSITA. The sensitivity threshold required to significantly detect an eruption is drawn 10 000 times from a Gaussian distribution. Each iteration of ξi is then computed by downsampling the observed QPEs light curves through the real eRASS cadence and it represents the probability that our QPE search algorithm would trigger on the light curve of that given source.
Current usage metrics show cumulative count of Article Views (full-text article views including HTML views, PDF and ePub downloads, according to the available data) and Abstracts Views on Vision4Press platform.
Data correspond to usage on the plateform after 2015. The current usage metrics is available 48-96 hours after online publication and is updated daily on week days.
Initial download of the metrics may take a while.