Fig. 1
Download original image
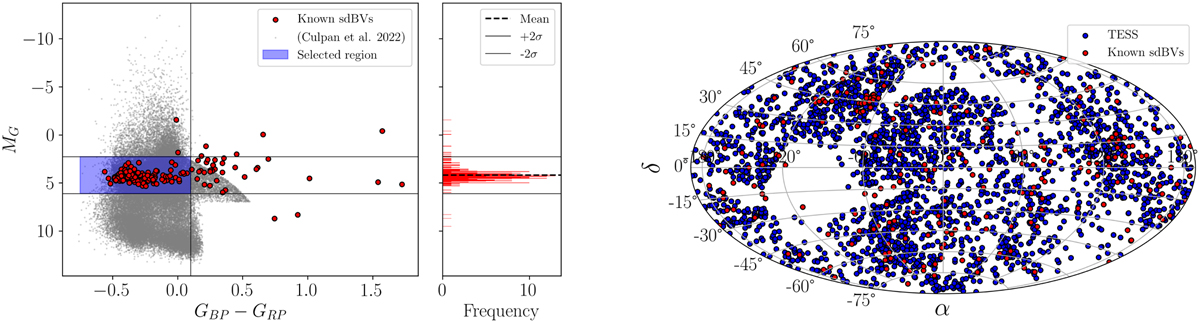
Left: color–magnitude diagram of identified potential hot subdwarf candidates with gray dots from Culpan et al. (2022). We highlight 256 known sdBVs compiled from the literature in red. A distribution plot (middle panel) is constructed based on the known pulsating sdBs. The mean value of the distribution is indicated by the horizontal dashed black line, and the upper and lower limits are shown by horizontal black lines. Our refined sample, which excludes composite binaries, is visualized as a blue shaded box in the color–magnitude diagram. Right: sky locations (Galactic coordinates, Aitoff projection) of the selected pulsating sdB candidates that are observed with TESS and known pulsating sdBs with respect to the Galactic coordinate system using the same color-coding.
Current usage metrics show cumulative count of Article Views (full-text article views including HTML views, PDF and ePub downloads, according to the available data) and Abstracts Views on Vision4Press platform.
Data correspond to usage on the plateform after 2015. The current usage metrics is available 48-96 hours after online publication and is updated daily on week days.
Initial download of the metrics may take a while.