Fig. 3.
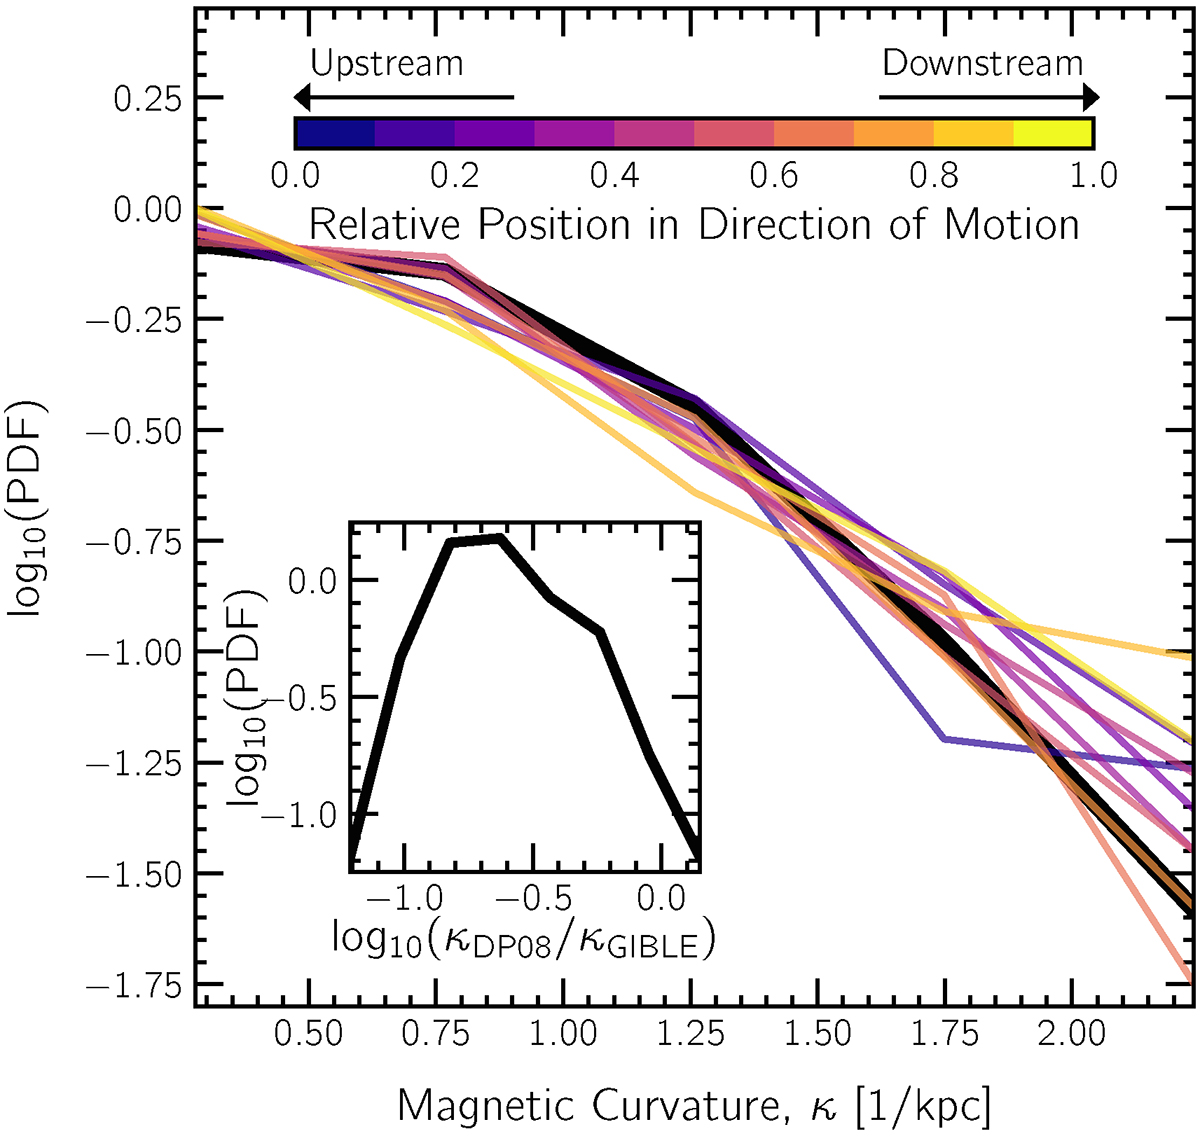
Download original image
Distribution of interface magnetic curvature values for our sample of Mcl ∼ 106 M⊙ clouds (main panel). The black curve is based on all interface gas, while the other curves show values derived using gas with different relative positions with respect to the direction of motion of the cloud. The purple curves show κ for the head or upstream regions, while the yellow curves show κ in the tail or downstream regions. The inset compares the upstream interface magnetic curvature from our simulations (κGIBLE) to a simple theoretical model (κDP08).
Current usage metrics show cumulative count of Article Views (full-text article views including HTML views, PDF and ePub downloads, according to the available data) and Abstracts Views on Vision4Press platform.
Data correspond to usage on the plateform after 2015. The current usage metrics is available 48-96 hours after online publication and is updated daily on week days.
Initial download of the metrics may take a while.