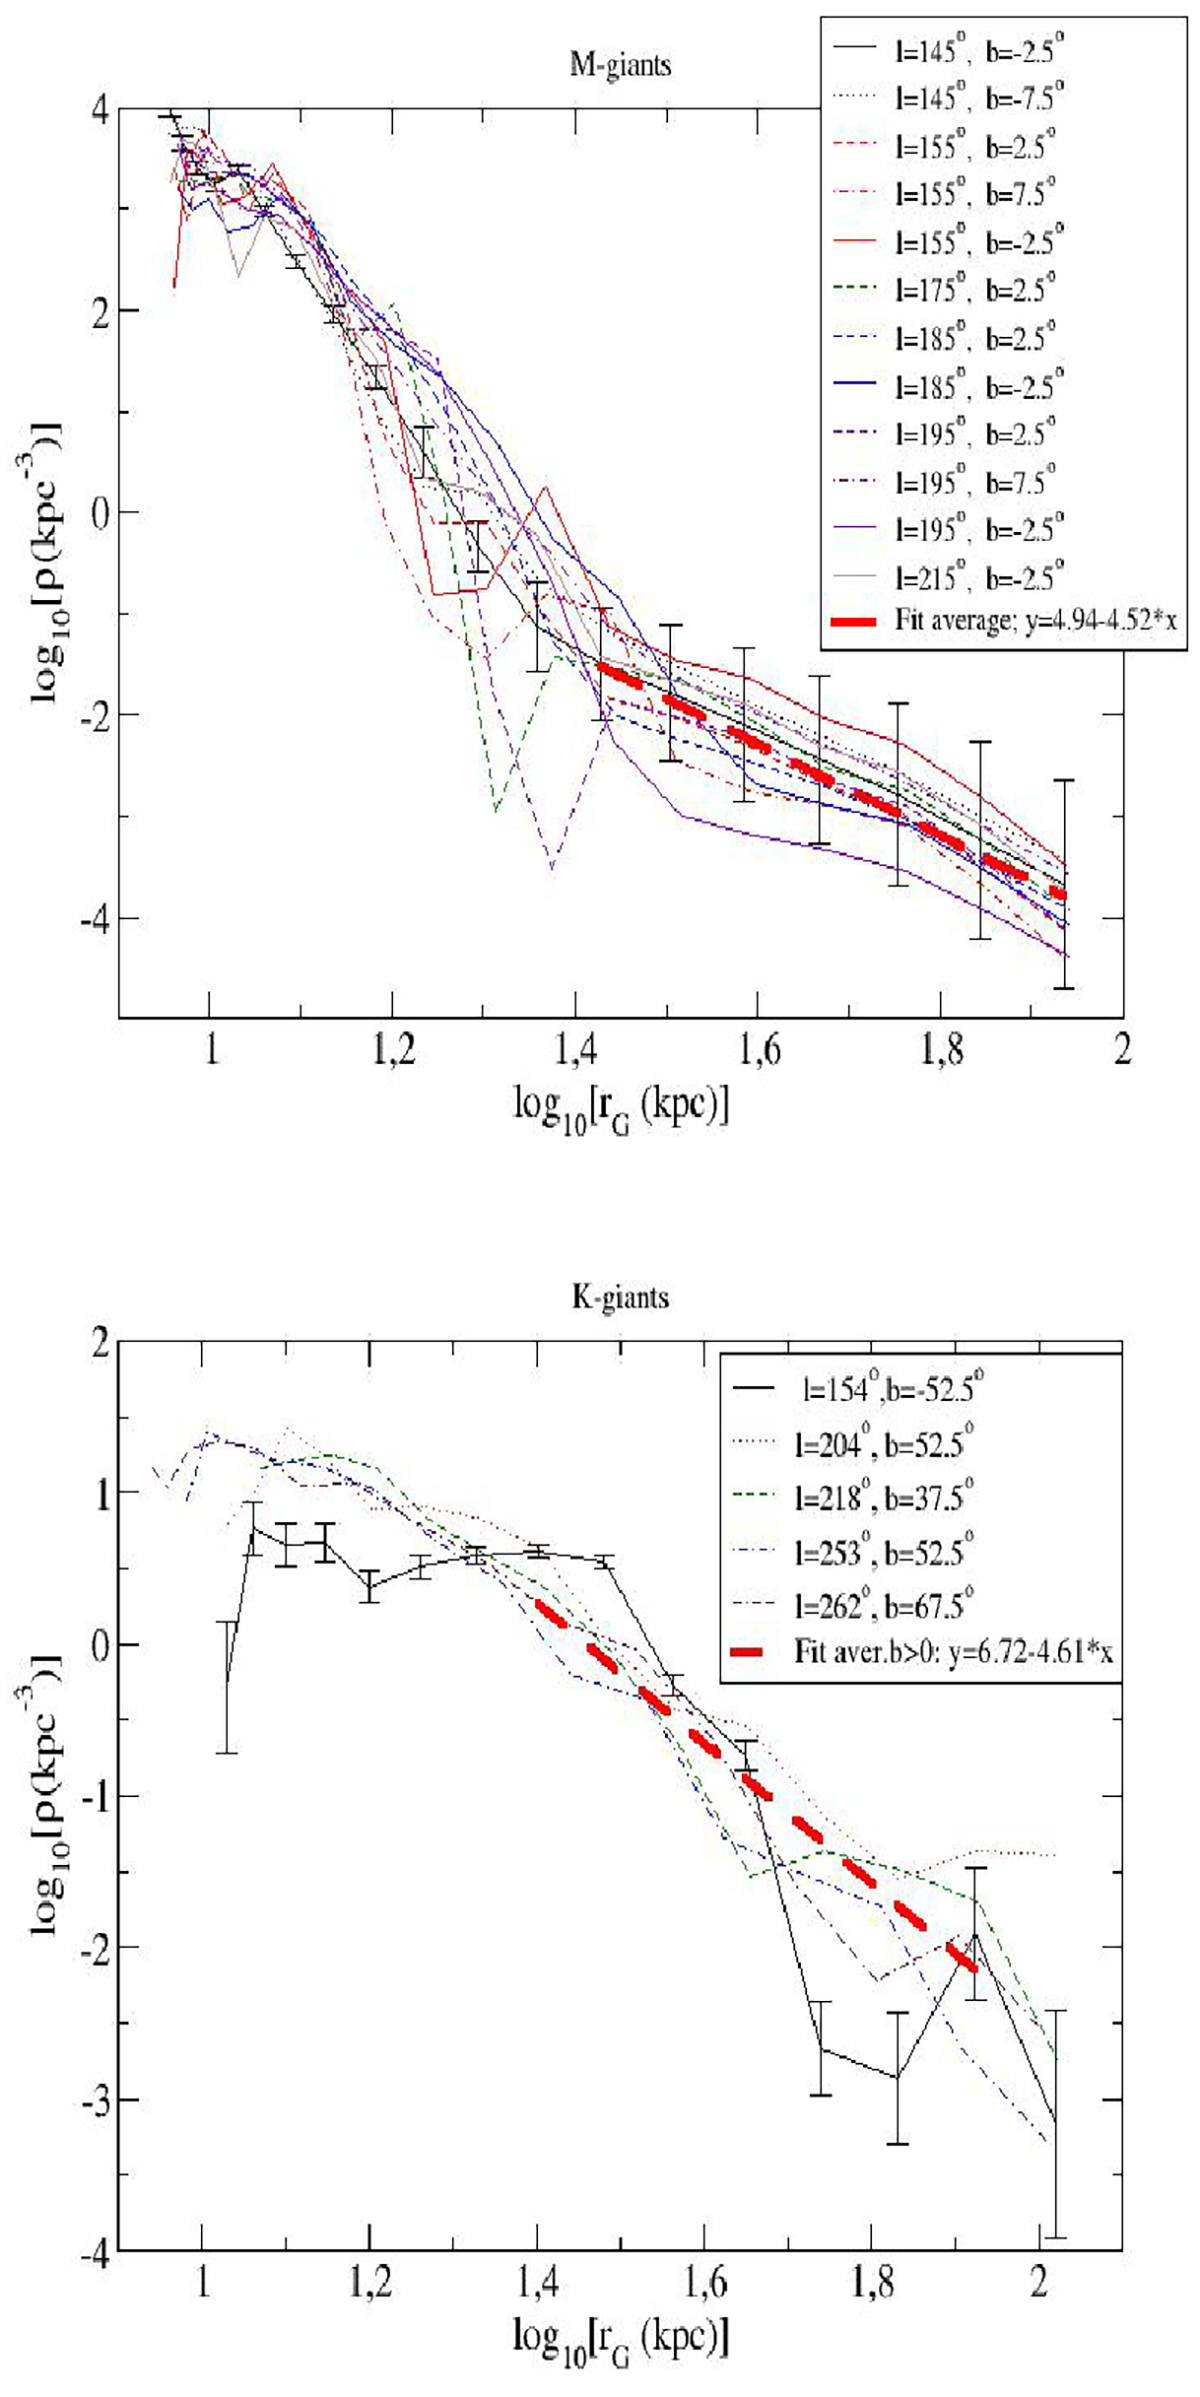
Fig. 6.
Download original image
Stellar density after deconvolution correction as a function of the distance to the Galactic centre. Upper panel: M-giants within 12 lines of sight with Δb = 5°, Δℓ = 10°. Bottom panel: K-giants within five lines of sight with Δb = 15°, Δℓ = 30 ° /cos(b). Fits correspond to the average of all lines of sight in the range log10[rG(kpc)] between 1.4 and 1.95, except the line ℓ = 154°, b = −52.5°, which presents an anomaly. Error bars (corresponding to the error of measured ρ0) of the first line of sight are plotted; for other lines of sight, the error bars are similar.
Current usage metrics show cumulative count of Article Views (full-text article views including HTML views, PDF and ePub downloads, according to the available data) and Abstracts Views on Vision4Press platform.
Data correspond to usage on the plateform after 2015. The current usage metrics is available 48-96 hours after online publication and is updated daily on week days.
Initial download of the metrics may take a while.