Fig. B.2
Download original image
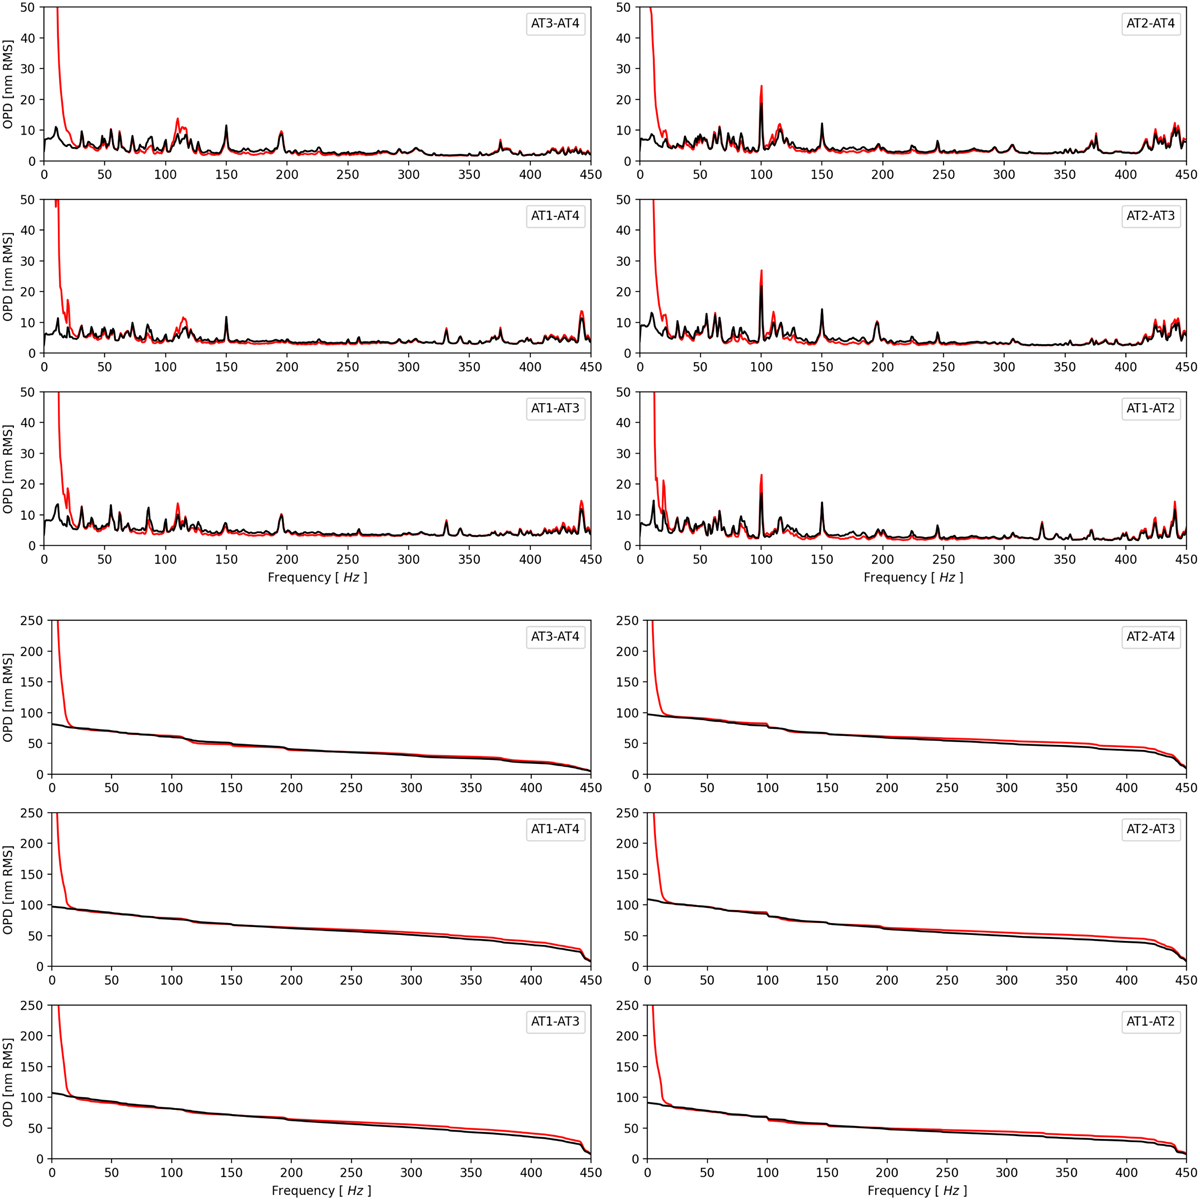
Power spectrum density and cumulative sum of the PSD of phase residuals (Φn) for target HR 7672. The back curves represent the close-loop values. The red curves represent the pseudo-open-loop values, signifying the scenario without a fringe tracker (Hϕ · L). The six lower plots show the reverse cumulative sum of the power spectrum. Over 100 s of a single scientific DIT, the residual standard deviation is 71 nm (UT3-UT4), 86 nm (AT2-AT4), 86 nm (AT1-AT4), 93 nm (AT2-AT3), 93 nm (AT1-AT3), and 80 nm (AT1-AT2).
Current usage metrics show cumulative count of Article Views (full-text article views including HTML views, PDF and ePub downloads, according to the available data) and Abstracts Views on Vision4Press platform.
Data correspond to usage on the plateform after 2015. The current usage metrics is available 48-96 hours after online publication and is updated daily on week days.
Initial download of the metrics may take a while.