Fig. 6
Download original image
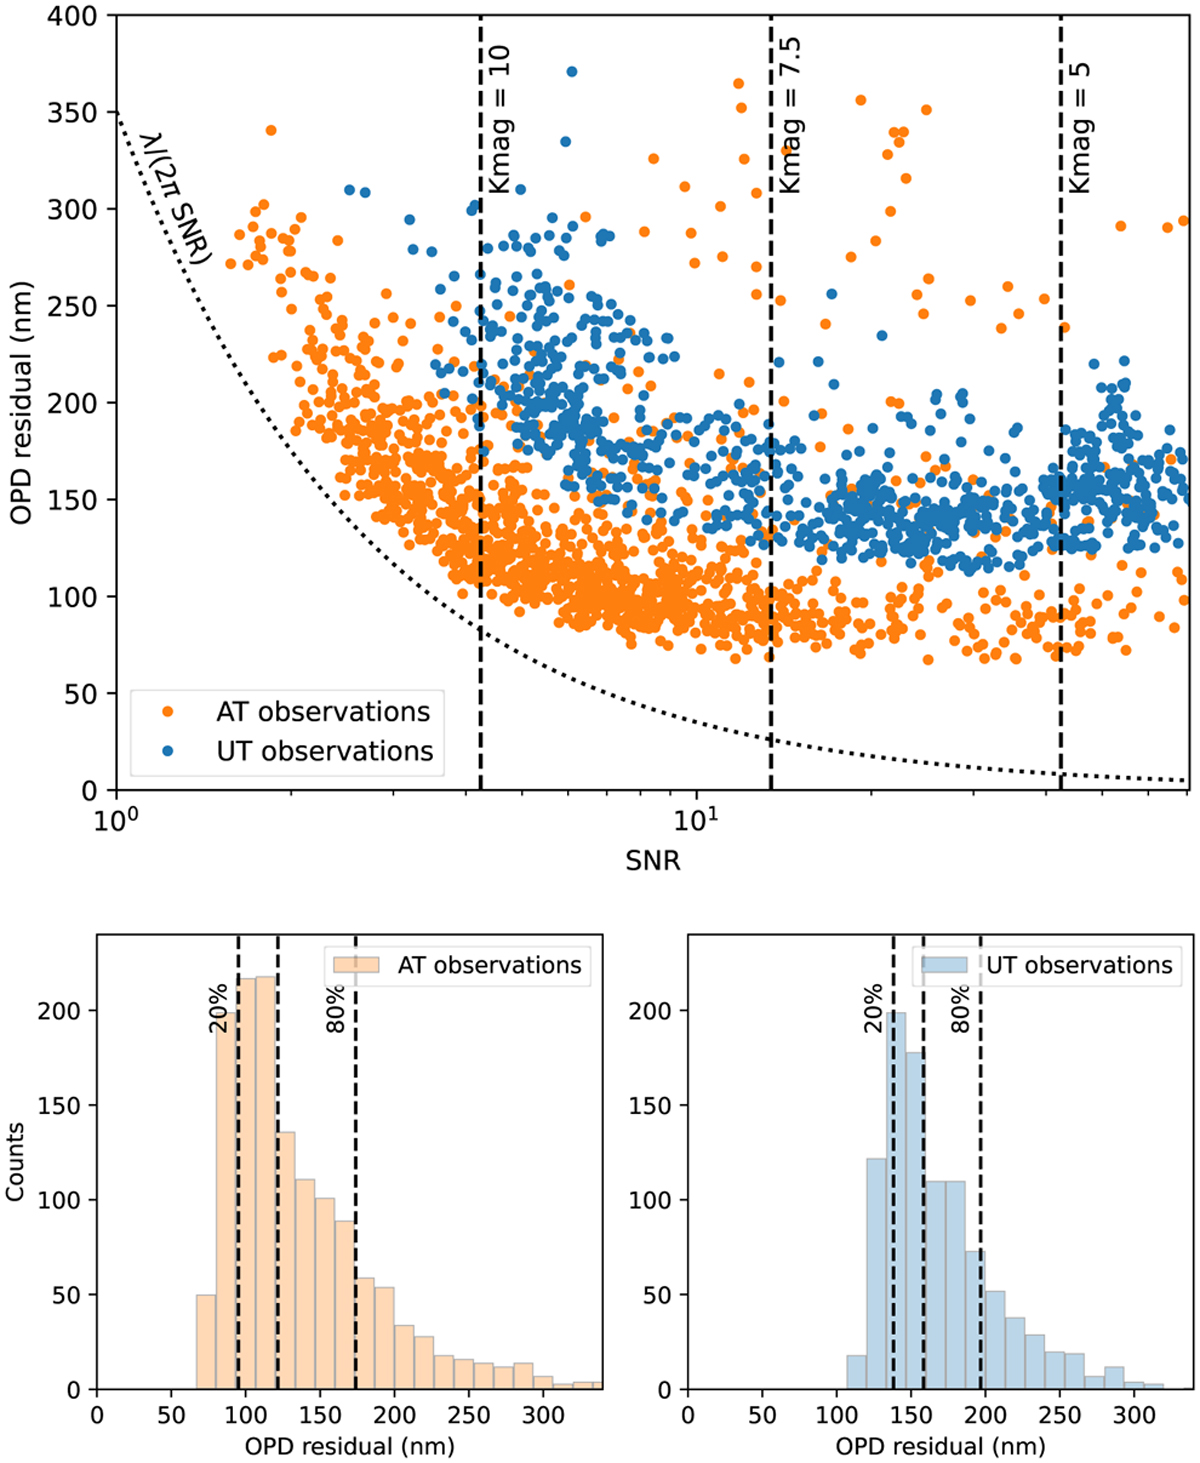
OPD residuals. Top panel: OPD residuals plotted against the S/N per baseline for all data collected from June to August 2023. The orange dots represent AT observations, and the blue dots denote UT observations. The dotted curve represents the theoretical limitation imposed by the measurement noise (λ/2πσj,k). The vertical dashed lines indicate the S/N observed with the UTs of a star at a given star magnitude. It should be shifted by about 2.5 magnitude for the ATs. Bottom panels: histogram of the same OPD residuals as in the upper panel for the ATs (left) and UTs (right).
Current usage metrics show cumulative count of Article Views (full-text article views including HTML views, PDF and ePub downloads, according to the available data) and Abstracts Views on Vision4Press platform.
Data correspond to usage on the plateform after 2015. The current usage metrics is available 48-96 hours after online publication and is updated daily on week days.
Initial download of the metrics may take a while.