Fig. 5
Download original image
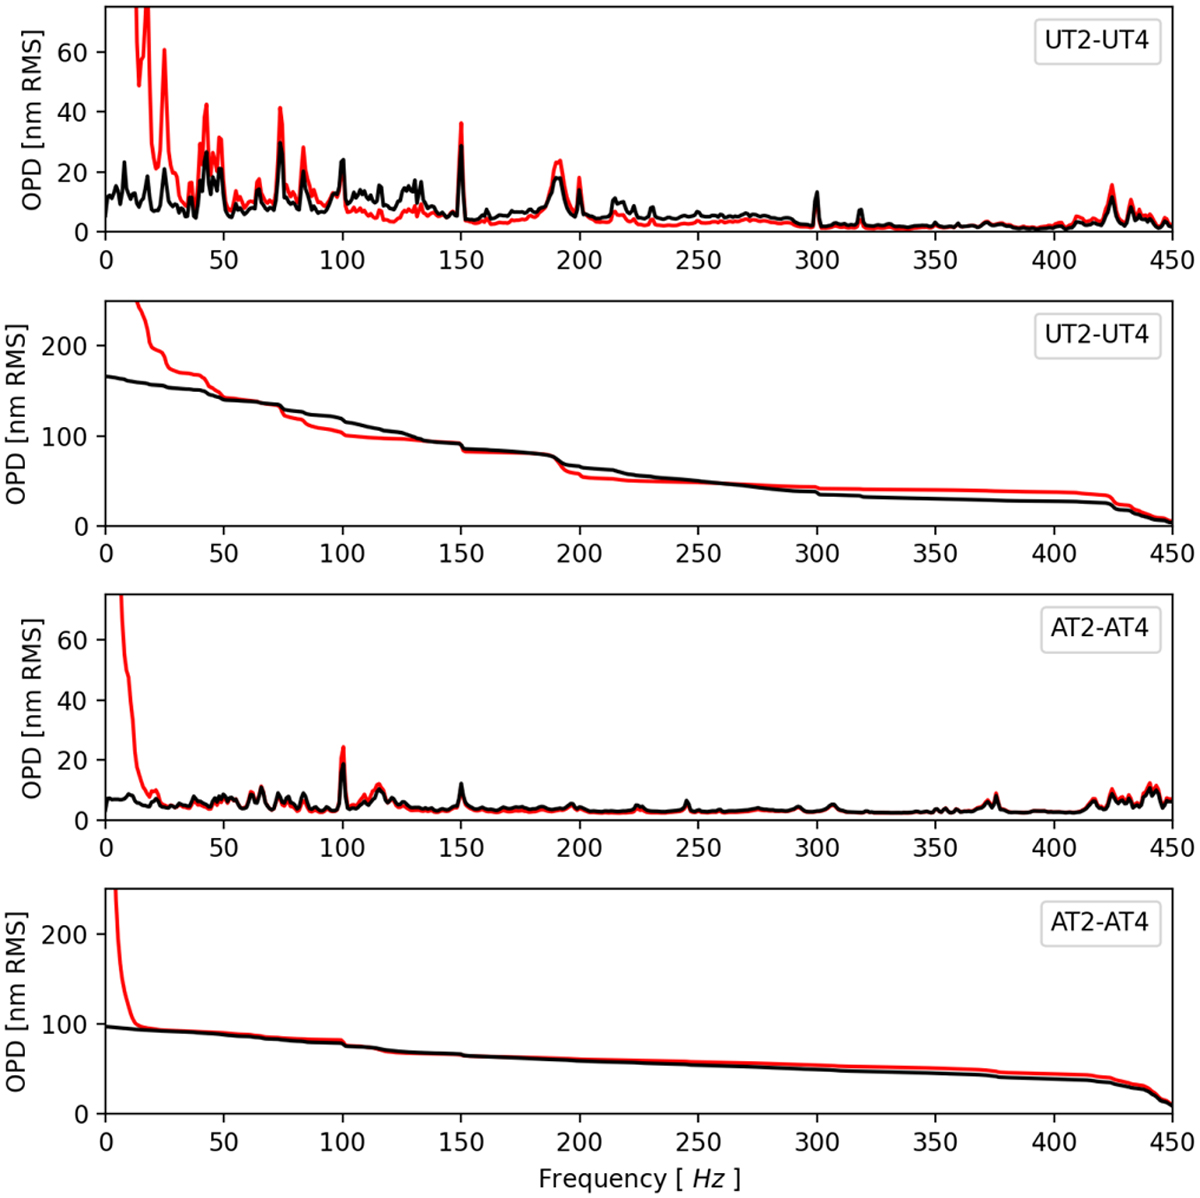
Spectra of the residual OPD (shown in black) and the reconstructed perturbation (Ηφ · L, depicted in red) for two observations. The upper panels present data on HR 8799 for one baseline from the UTs, corresponding to the data shown in Fig. 4. The standard deviation of the OPD is 151 nm. The panel below shows a dataset from the ATs for HR 7672 with an OPD standard deviation of 86 nm. The cumulative spectrum for these two dataset are also shown. The data for all baselines are presented in Appendix B.
Current usage metrics show cumulative count of Article Views (full-text article views including HTML views, PDF and ePub downloads, according to the available data) and Abstracts Views on Vision4Press platform.
Data correspond to usage on the plateform after 2015. The current usage metrics is available 48-96 hours after online publication and is updated daily on week days.
Initial download of the metrics may take a while.