Fig. 4
Download original image
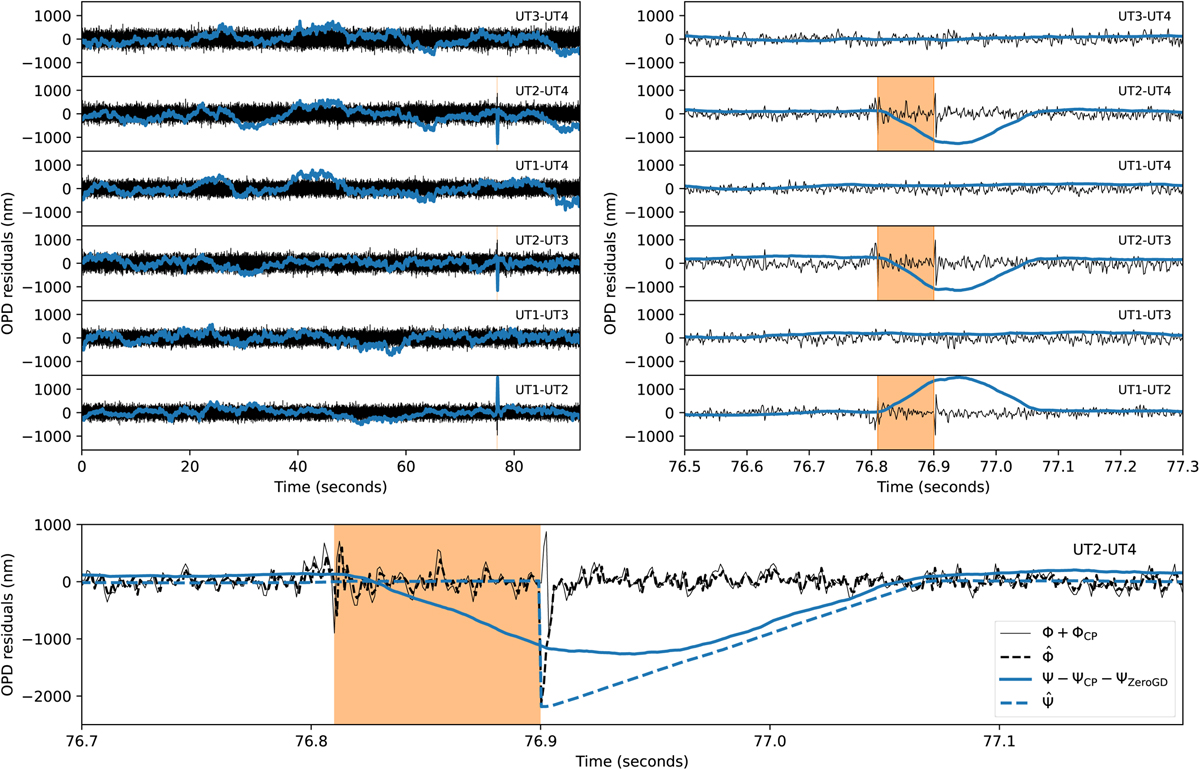
Observation of star HR 8799 using GRAVITY. The data are taken from a single DIT exposure on the spectrometer, spanning 100 s. The black curves denote the OPD, derived from the phase delay (Φ – ΦCP). The blue curves illustrate observations from the group delay (Ψ – ΨCP – ΨZeroGD). Each panel represents a different baseline. At t1 = 76.81 s, a noticeable fringe jump occurred on UT2. The effect of this jump across all baselines is depicted in the right panels. Impressively, the group delay identified and corrected the jump within 100 ms. The lower panel offers a magnified perspective of the baseline between UT2 and UT4, and the predictions from the controller state ![]() and
and ![]() are overlaid. Notably, at t2 = 76.9 s, all predictions shifted by 2200 nm, marking the detection of the jump. To shift the OPD by one λ, the phase delay took 3 DITs (3.3 ms), while the group delay took 150 DITs (165 ms), which is attributed to the smoothing length of the observable.
are overlaid. Notably, at t2 = 76.9 s, all predictions shifted by 2200 nm, marking the detection of the jump. To shift the OPD by one λ, the phase delay took 3 DITs (3.3 ms), while the group delay took 150 DITs (165 ms), which is attributed to the smoothing length of the observable.
Current usage metrics show cumulative count of Article Views (full-text article views including HTML views, PDF and ePub downloads, according to the available data) and Abstracts Views on Vision4Press platform.
Data correspond to usage on the plateform after 2015. The current usage metrics is available 48-96 hours after online publication and is updated daily on week days.
Initial download of the metrics may take a while.