Fig. B.1.
Download original image
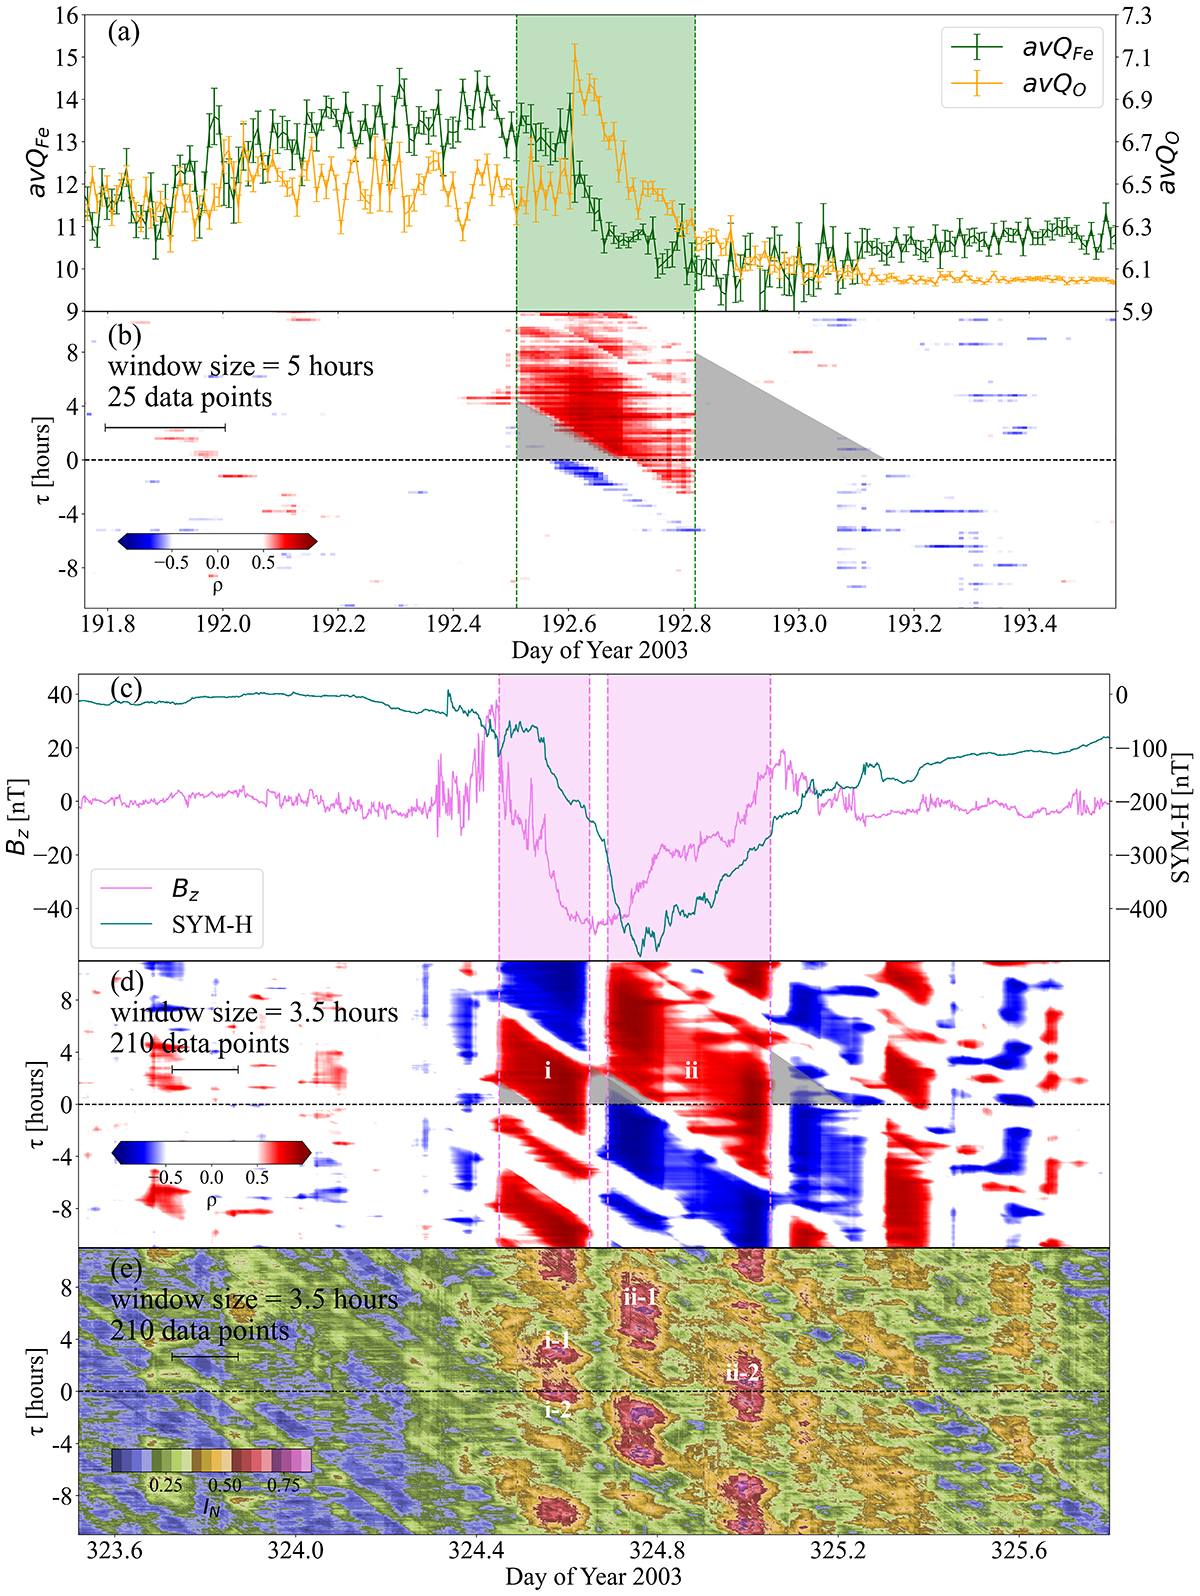
Two examples of the SWCC map. (a) Averaged charge states of iron and oxygen ions measured by ACE/SWICS. The time resolution is 12 minutes. (b) The SWCC map of averaged charge states of iron and oxygen ions in solar wind. w = 5 hours. Green dashed lines mark the left and right boundaries of the red parallelogram. Grey triangles are defined by the boundaries of the parallelogram and the baseline. (c) Measured z component of the solar wind magnetic field (Bz in Geocentric Solar Ecliptic coordinate system) from ACE and the symmetric disturbances for horizontal component of the geomagnetic field (SYM-H) provided by the WDC for Geomagnetism, Kyoto. The time resolution is 1 minute. w = 3.5 hours. (d) The SWCC map of Bz and SYM-H. Violet dashed lines show the left and right boundaries of the two red parallelogram that marked as structures i and ii. Grey triangles are defined by the boundaries of the parallelogram and the baseline. (e) The SWMI map of Bz and SYM-H. We mark four sub-structures of structure i and ii as structures i − 1, i − 2, ii − 1, and ii − 2.
Current usage metrics show cumulative count of Article Views (full-text article views including HTML views, PDF and ePub downloads, according to the available data) and Abstracts Views on Vision4Press platform.
Data correspond to usage on the plateform after 2015. The current usage metrics is available 48-96 hours after online publication and is updated daily on week days.
Initial download of the metrics may take a while.