Fig. 5.
Download original image
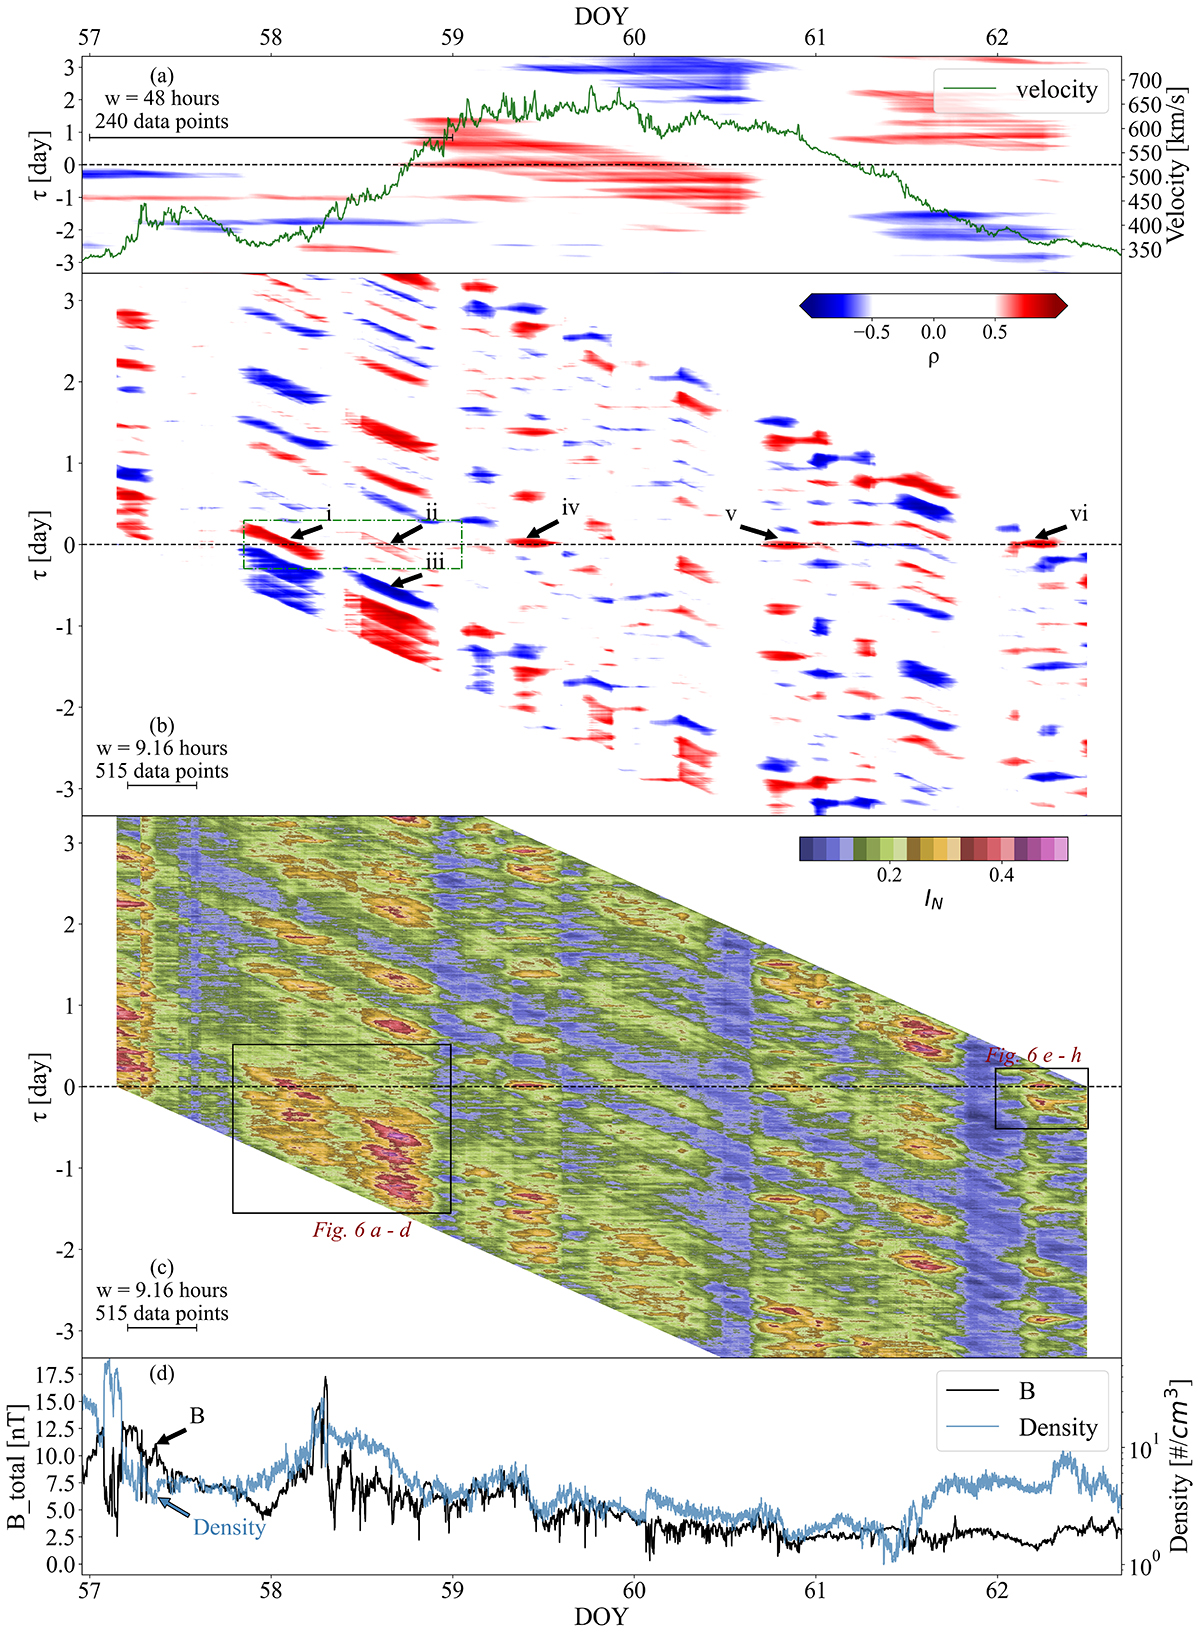
SWCC and SWMI map of the selected time period I in Fig. 4a. Window sizes, number of data points in each window, and the visible window scales are marked below the serial number of each sub-plot. (a) Zoom on Fig. 4b. (b) The SWCC map based on 64-s resolution data. Black arrows mark six structures with high cc. Green dotted-dashed lines mark the region which is analyzed in Fig. 3. (c) The SWMI map based on 64-s resolution data. Black rectangles mark two regions analyzed in Fig. 6. (d) 64-s resolution solar wind proton density and magnetic field strength measurements.
Current usage metrics show cumulative count of Article Views (full-text article views including HTML views, PDF and ePub downloads, according to the available data) and Abstracts Views on Vision4Press platform.
Data correspond to usage on the plateform after 2015. The current usage metrics is available 48-96 hours after online publication and is updated daily on week days.
Initial download of the metrics may take a while.