Fig. 4.
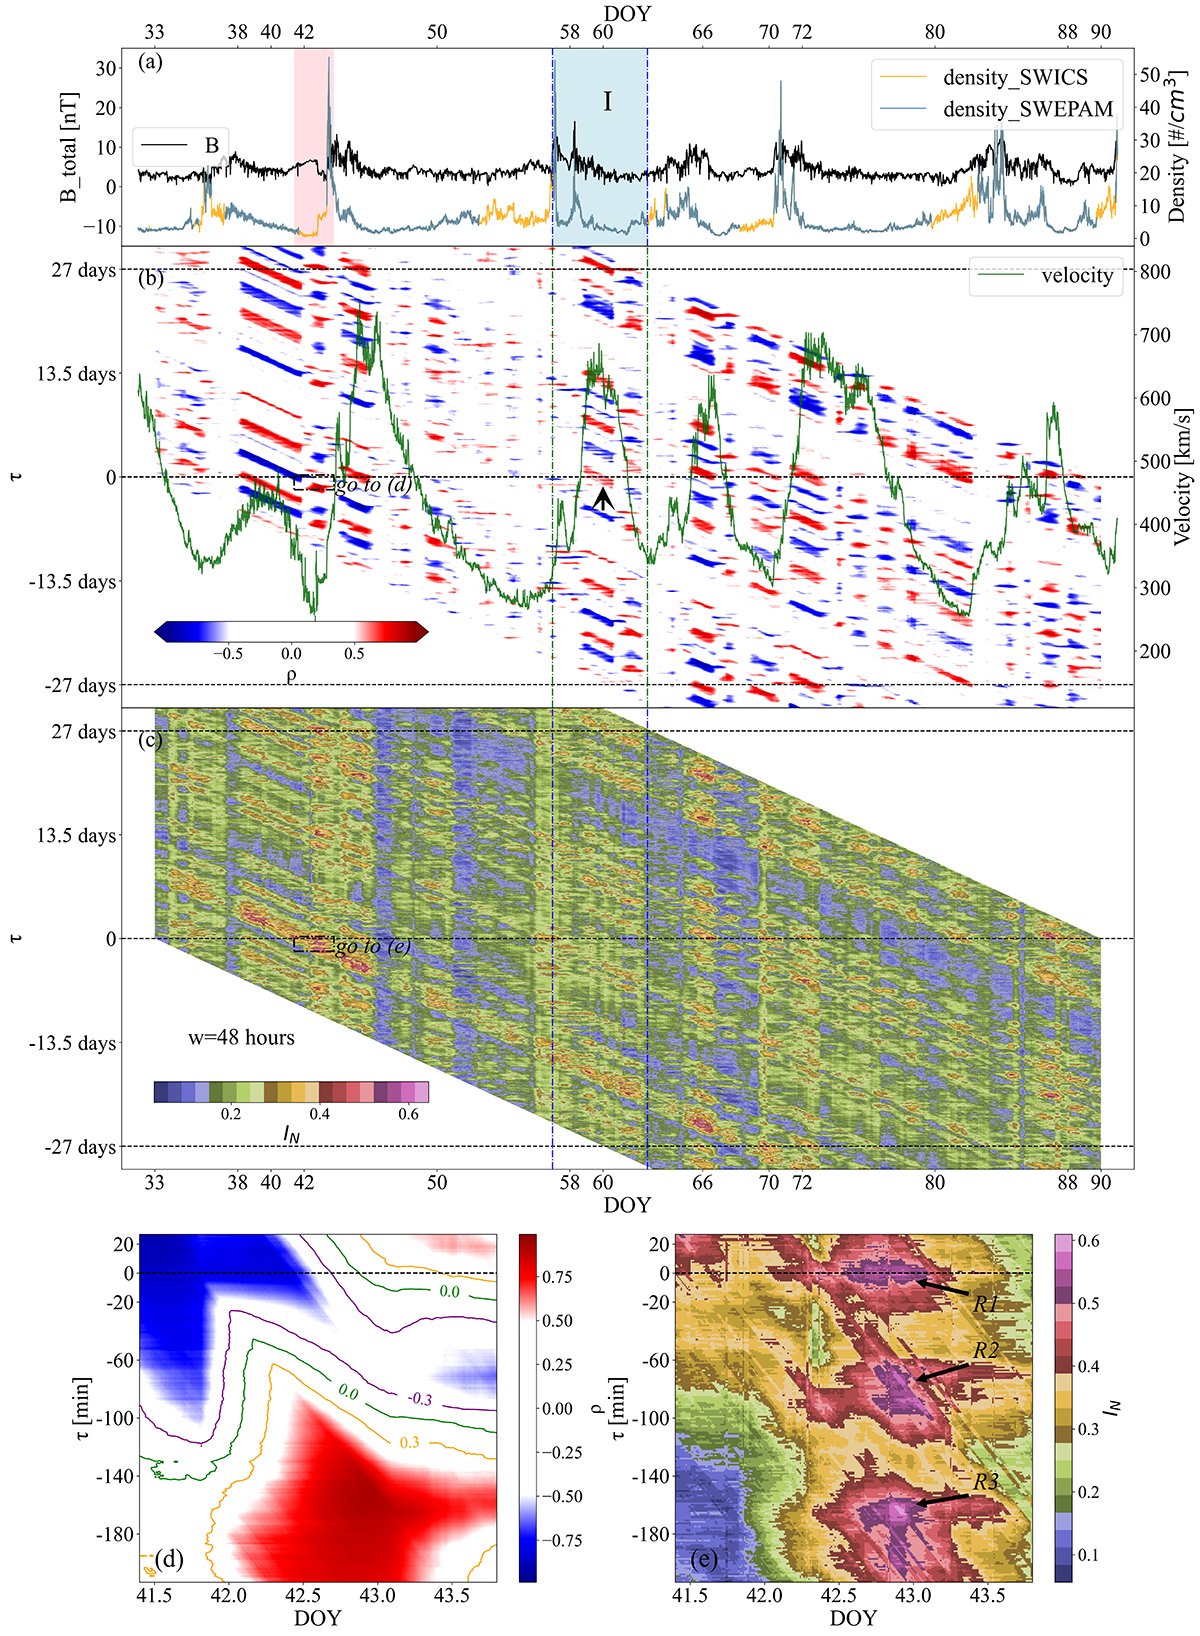
Download original image
In situ measurements related SWCC and SWMI map of two months of solar wind. (a) Solar wind density and magnetic field strength measurements. Blue shaded region marks the selected period for further study in Sect. 4.2, pink region marks the zoomed in area. (b) The SWCC map based on 12-min resolution data and solar wind velocity. (c) The SWMI map based on 12-min resolution data. (d) Zoom on panel b with extra contours. (e) Zoom on panel c, regions with relatively high IN are marked.
Current usage metrics show cumulative count of Article Views (full-text article views including HTML views, PDF and ePub downloads, according to the available data) and Abstracts Views on Vision4Press platform.
Data correspond to usage on the plateform after 2015. The current usage metrics is available 48-96 hours after online publication and is updated daily on week days.
Initial download of the metrics may take a while.