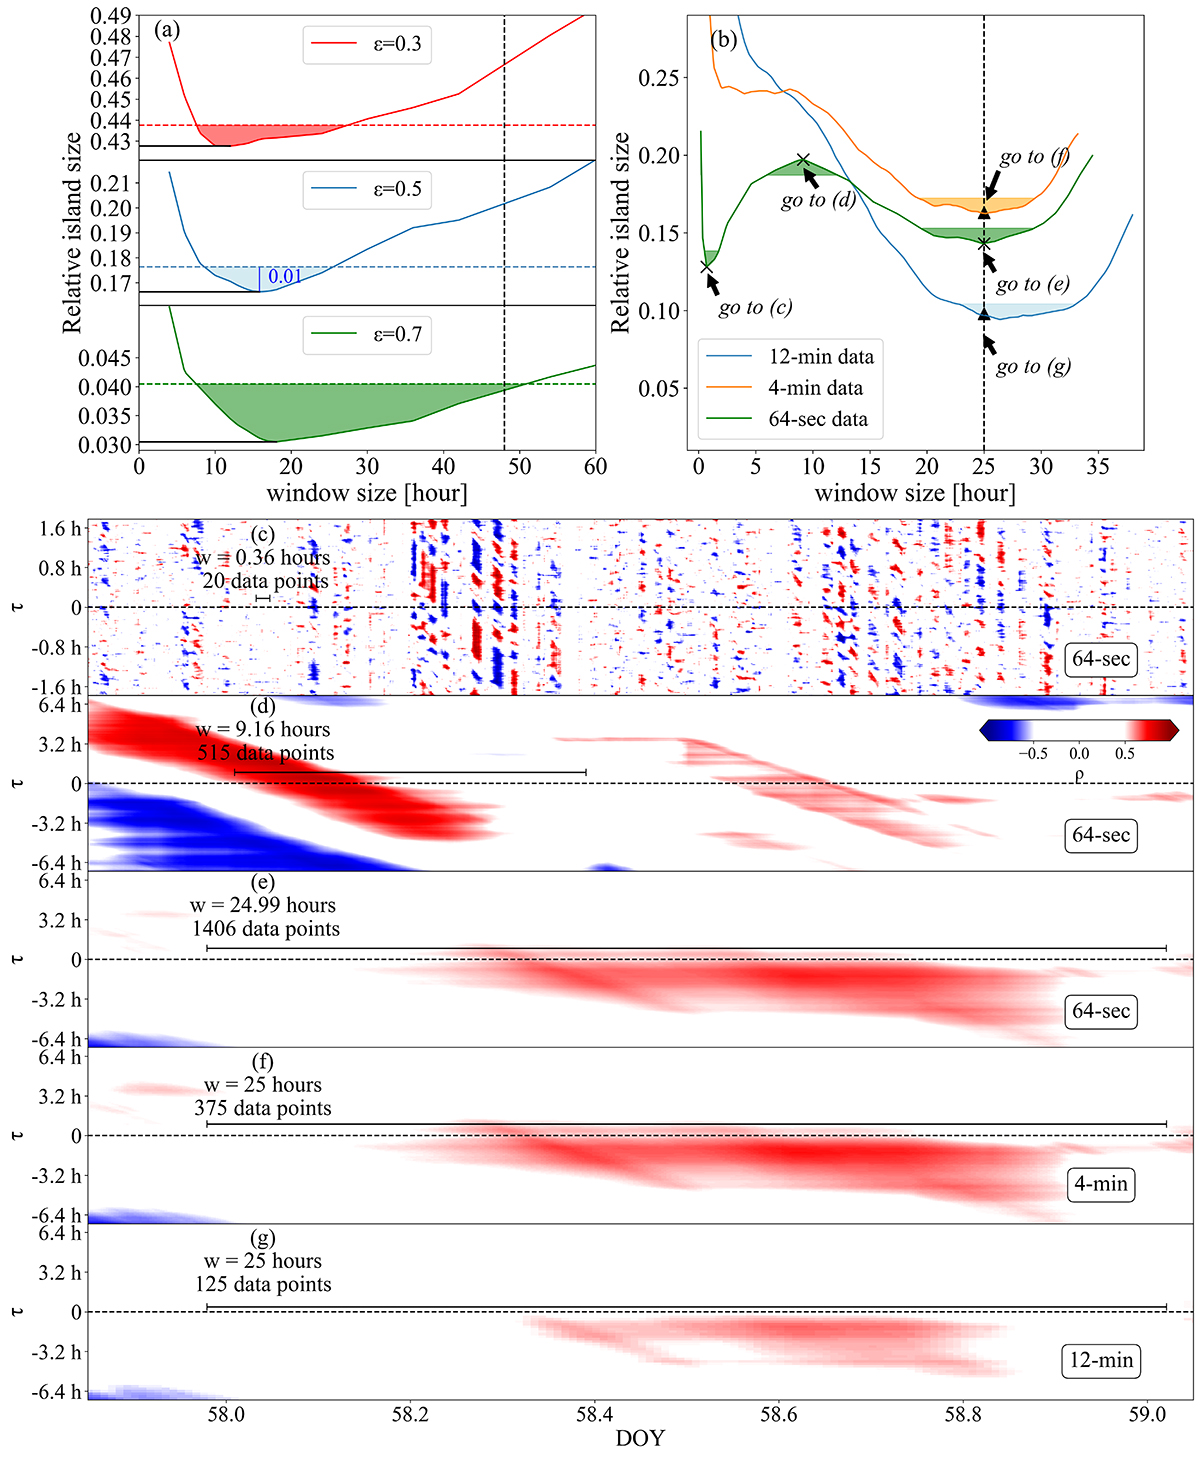
Fig. 3.
Download original image
Relative island size curves to guide the window size selection and an example of the SWCC maps of the same period but under different window sizes or time resolutions. The horizontal boundary of the shaded area (horizontal line) for each curve is defined as the minimum value of η plus 1% (or maximum minus 1%). (a) Relative island size curves with different thresholds for data used in Fig. 4, Δmax = 30 days. The black dashed line marks the window size we manually choose for the analysis in Sect. 4.1, which is 48 h. (b) Relative island size curves for data with different time resolution applied in Fig. 5. ϵ = 0.5, Δmax = 12 h. The black dashed line marks w = 25 h. The black crosses mark two local minima and one local maximum, triangles mark where w = 25 h. (c) The SWCC map for partial data (64-s resolution) applied in Fig. 5, the window size is 0.36 h, corresponding to the left cross in panel b. (d) The SWCC map for the same data applied in panel c, the window size is 9.16 h, corresponding to the middle cross in panel b. (e) The SWCC map for the same data applied in panel c, the window size is 24.99 h, corresponding to the right cross in panel b. (f) Same window size as panel e but with 4-min data. (g) Same as panel e, but with 12-min data.
Current usage metrics show cumulative count of Article Views (full-text article views including HTML views, PDF and ePub downloads, according to the available data) and Abstracts Views on Vision4Press platform.
Data correspond to usage on the plateform after 2015. The current usage metrics is available 48-96 hours after online publication and is updated daily on week days.
Initial download of the metrics may take a while.