Fig. 2.
Download original image
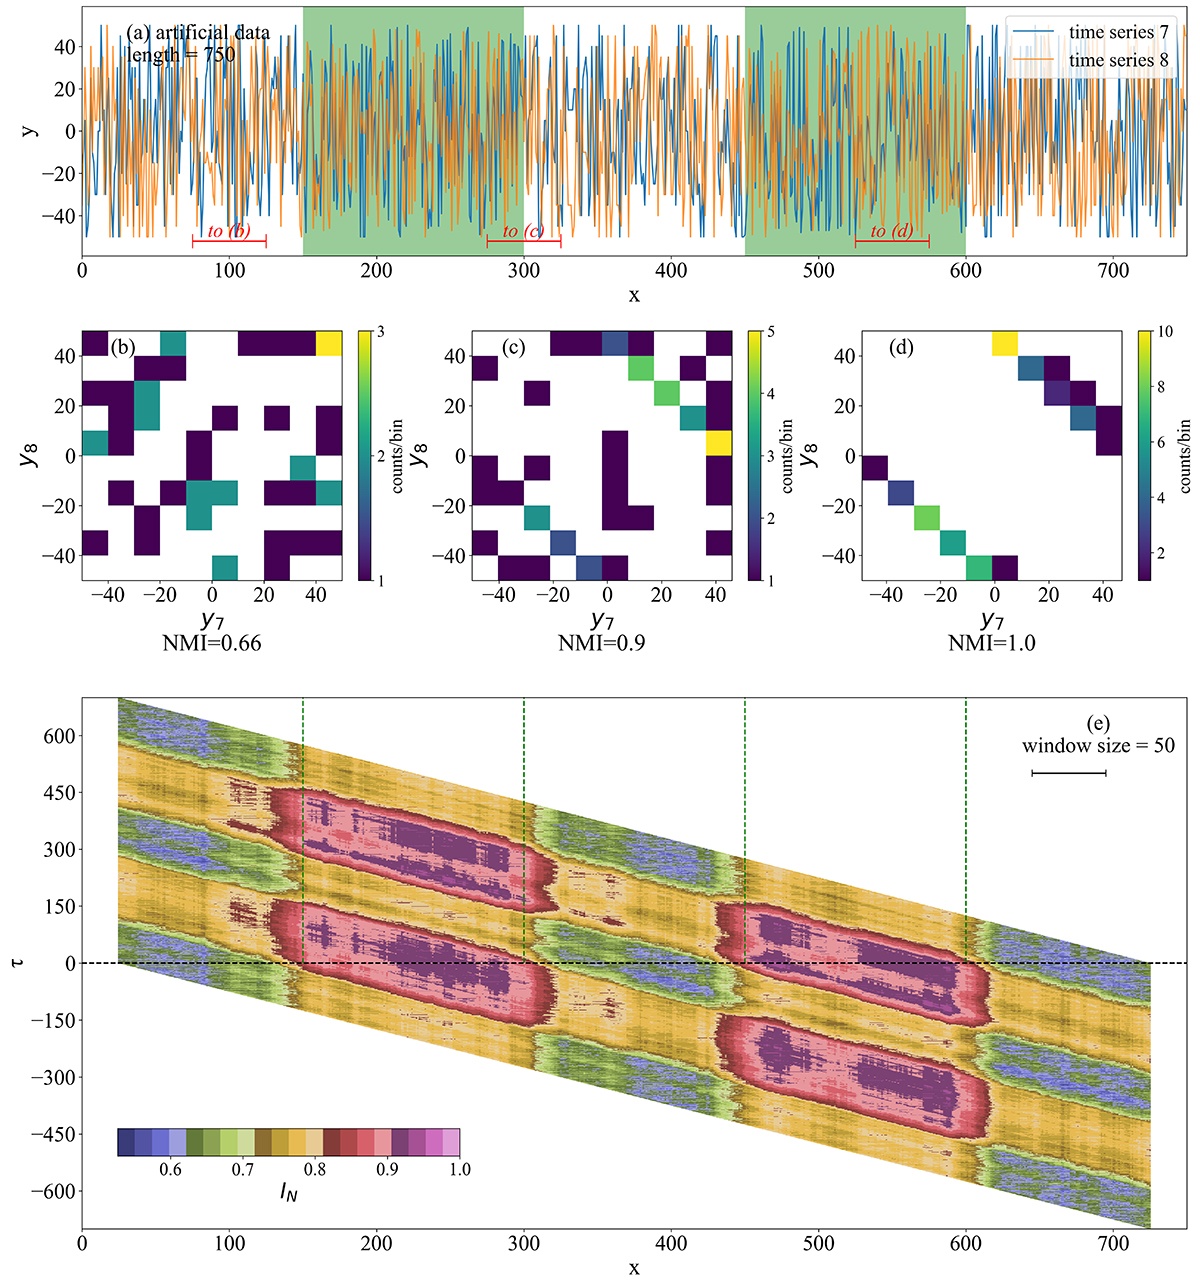
Two artificial series and related SWMI map. (a) The artificial time series, all values are integers. Green regions are two periods where two series have a unique mapping relationship (see Eq. (8)). Red line segments mark three positions where the distributions of windowed data are shown in following histograms. (b) Histogram of two windowed series marked by the first red line segment. (c) Histogram of two windowed series marked by the second red line segment. (d) Histogram of two windowed series marked by the third red line segment. (e) The SWMI map with a window size of 50, which is also graphically shown below the text. Green dashed lines are boundaries of the green regions in panel a. In panels b–d, the bin size is chosen according to Eq. (7).
Current usage metrics show cumulative count of Article Views (full-text article views including HTML views, PDF and ePub downloads, according to the available data) and Abstracts Views on Vision4Press platform.
Data correspond to usage on the plateform after 2015. The current usage metrics is available 48-96 hours after online publication and is updated daily on week days.
Initial download of the metrics may take a while.