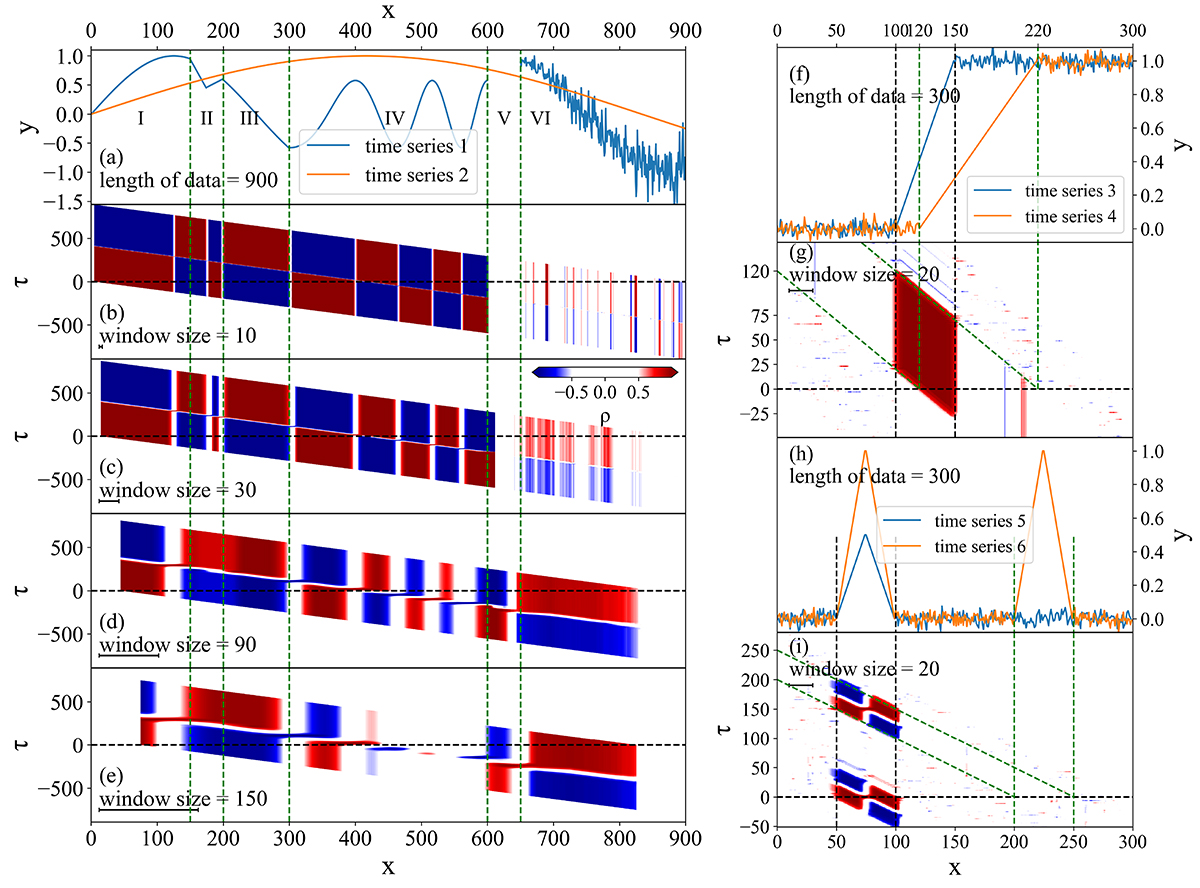
Fig. 1.
Download original image
The SWCC map for different sets of artificial time series. All maps share the same color bar shown in panel c. The black line below “window size” represents the size of the window. (a) First set of artificial time series. (b) The SWCC map with a relatively small window size of 10. (c) The SWCC map with a window size of 30. (d) The SWCC map with a window size of 90. (e) The SWCC map with a relatively large window size of 150. (f) Second set of artificial time series. Black vertical dashed lines mark the start and end time of the rising phase of time series 3, while green vertical dashed lines mark that of time series 4. (g) The SWCC map with a window size of 20. Slanted green dashed lines mark the lower and upper boundary of the parallelogram. (h) Third set of artificial time series. (i) The SWCC map with a window size of 20. Dashed lines have similar functions as those in panels g and h.
Current usage metrics show cumulative count of Article Views (full-text article views including HTML views, PDF and ePub downloads, according to the available data) and Abstracts Views on Vision4Press platform.
Data correspond to usage on the plateform after 2015. The current usage metrics is available 48-96 hours after online publication and is updated daily on week days.
Initial download of the metrics may take a while.