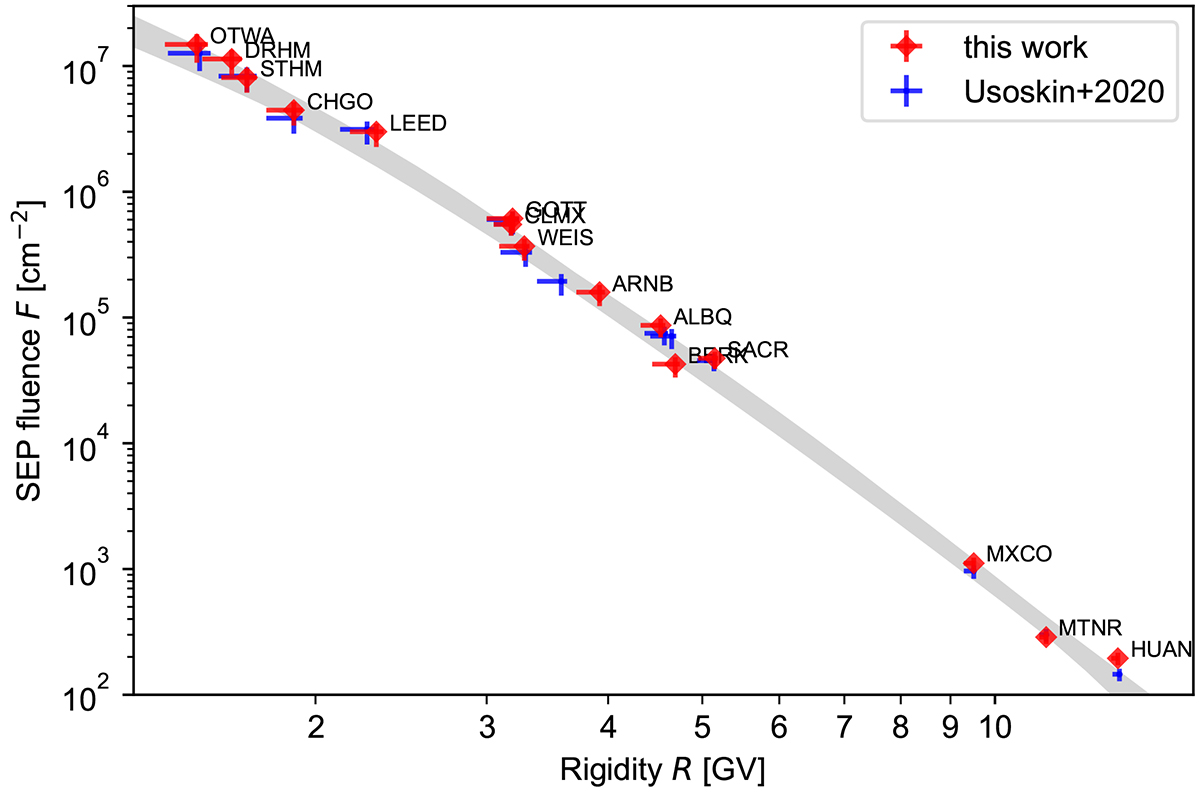
Fig. 5.
Download original image
SEP fluence during GLE #5 calculated using the effective rigidity method. The results obtained with the data collected in this study are shown as red points, while the reconstruction from Usoskin et al. (2020a) is shown with blue markers. The 68% confidence interval for the best fit with power law of rigidity with exponential cutoff performed in Usoskin et al. (2020a) is shown as grey shade.
Current usage metrics show cumulative count of Article Views (full-text article views including HTML views, PDF and ePub downloads, according to the available data) and Abstracts Views on Vision4Press platform.
Data correspond to usage on the plateform after 2015. The current usage metrics is available 48-96 hours after online publication and is updated daily on week days.
Initial download of the metrics may take a while.