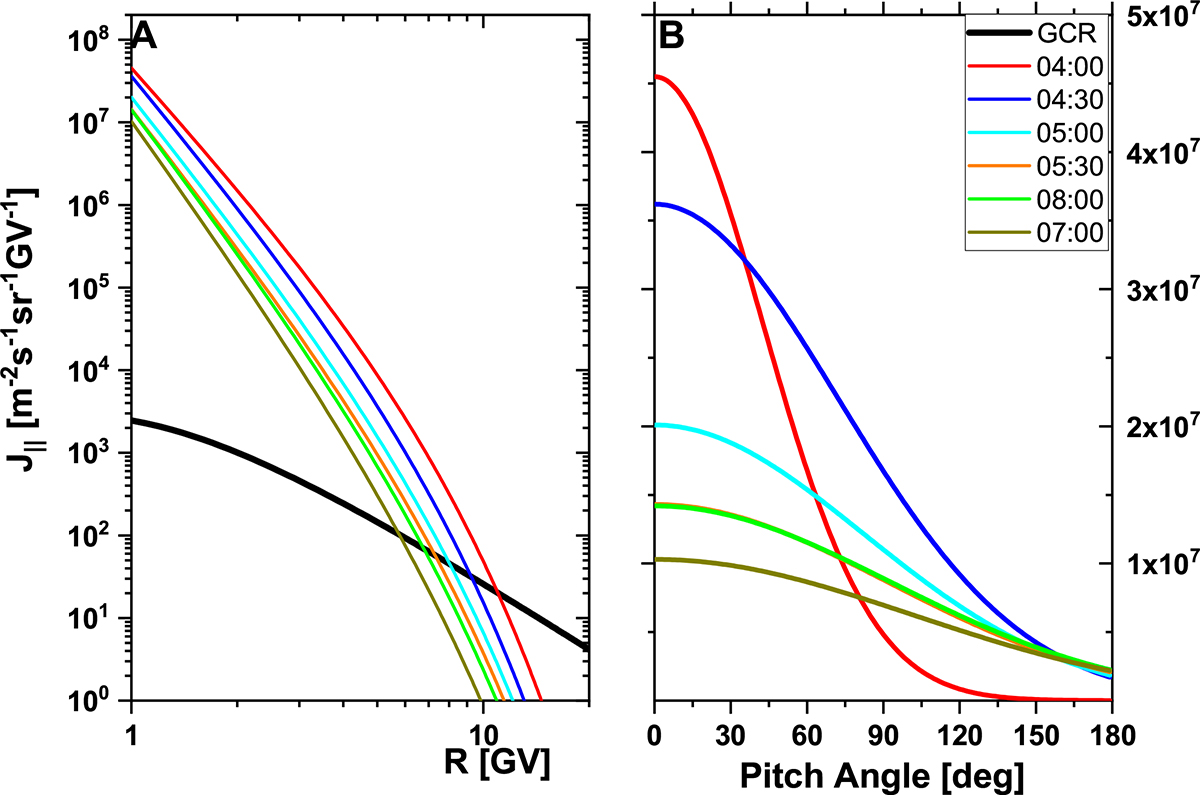
Fig. 4.
Download original image
Derived rigidity spectra along the axis of symmetry (panel A) and illustration of PAD (given with respect to the axis of symmetry at 1 GV, panel B) during selected periods of GLE #5. The black solid line corresponds to the GCR flux. The times (UT) in the legend refer to the beginnings of the 15 min integration intervals over which the data are taken.
Current usage metrics show cumulative count of Article Views (full-text article views including HTML views, PDF and ePub downloads, according to the available data) and Abstracts Views on Vision4Press platform.
Data correspond to usage on the plateform after 2015. The current usage metrics is available 48-96 hours after online publication and is updated daily on week days.
Initial download of the metrics may take a while.