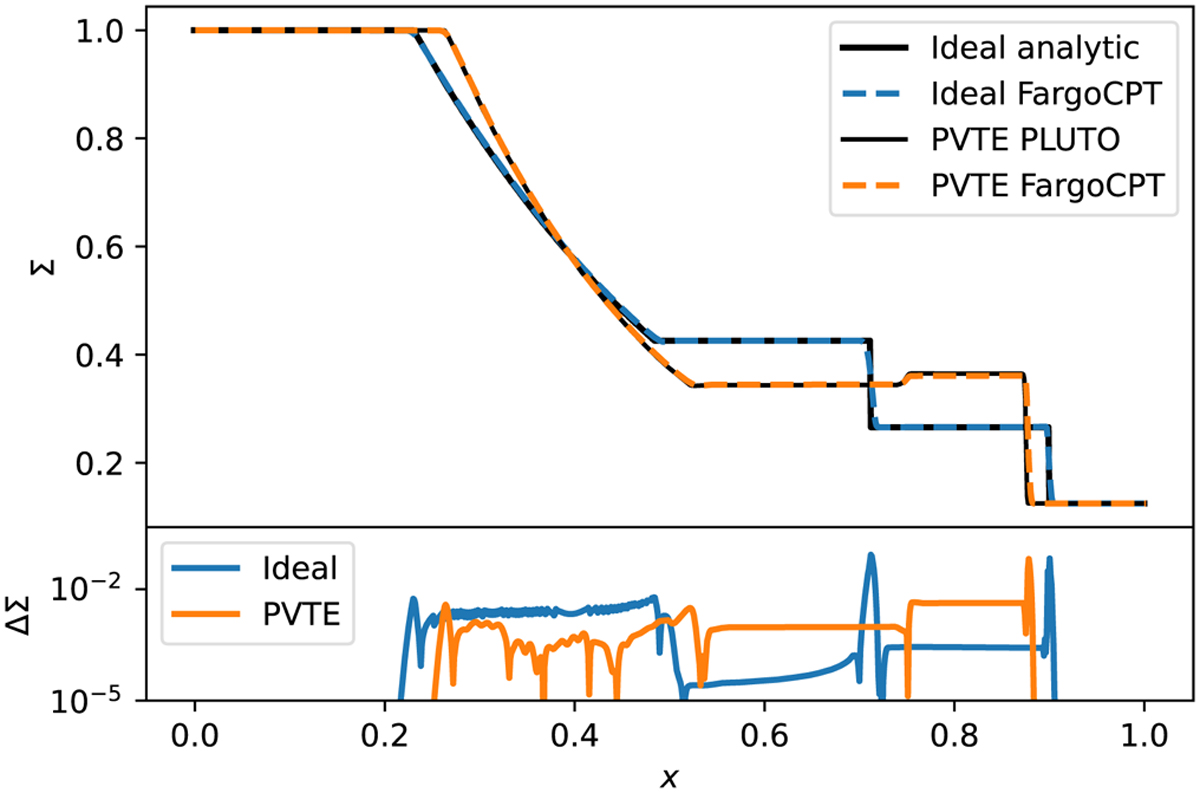
Fig. D.3
Download original image
Gas surface densities of the shock tube test with 100 cells for different combinations of artificial viscosity and integration schemes as well as for the caloric equation of state (PVTE) by Vaidya et al. (2015) with 1000 cells. The simulation time is t = 0.228 in both cases. The top and bottom panels show the surface density and the deviations from the reference case respectively, respectively.
Current usage metrics show cumulative count of Article Views (full-text article views including HTML views, PDF and ePub downloads, according to the available data) and Abstracts Views on Vision4Press platform.
Data correspond to usage on the plateform after 2015. The current usage metrics is available 48-96 hours after online publication and is updated daily on week days.
Initial download of the metrics may take a while.